TL;DR: A healthy net profit margin for a small retail store is 5-10%, but the average sits closer to 2-3% — the gap between gross margin (often 50%+) and net margin is where most owners lose money to rent, labor, and overhead.
By Goldseed Research · March 2026
Most small retail owners calculate their profit margin the same way: they look at what they paid for goods, subtract it from what they sold it for, and smile at the 50% difference. Then they get to the end of the month and wonder where it all went. A retail store profit margin tells a story, but only if you’re reading the right number. The difference between gross margin and net margin determines whether you’re actually building equity or just trading time for revenue.
The Short Answer: What Retail Margins Actually Look Like in 2026
The numbers reveal why profit margins deceive so many new retail owners. According to Statista, the average retail store maintains a gross profit margin of approximately 53% across all categories — meaning for every dollar in sales, 53 cents remains after paying for the goods themselves. But that’s not profit. That 53 cents has to cover rent, payroll, utilities, insurance, marketing, and administrative costs.
The National Retail Federation reports that the average net profit margin in retail sits between 2-3%. That’s the money left after expenses. A store with $500,000 in annual revenue and a 3% net margin keeps $15,000. A “good” retail store profit margin — one that justifies the investment and effort — sits in the 5-10% range. Specialty retailers can push into 10-17% net territory, but this requires category selection, operational discipline, or both.
The collapse from 53% gross to 2-3% net isn’t a flaw in the model. It’s the operating cost structure of physical retail. Understanding where that 50-percentage-point gap goes is the foundation for evaluating whether your store will be profitable and whether your store profit margin is competitive within its category.
Profit Margins by Retail Category: Where the Money Is
Not all retail categories are created equal. The data shows clear hierarchies in profitability, driven by inventory turnover, rent-to-revenue ratios, and labor intensity. This is critical for investors or owners evaluating which category to enter.
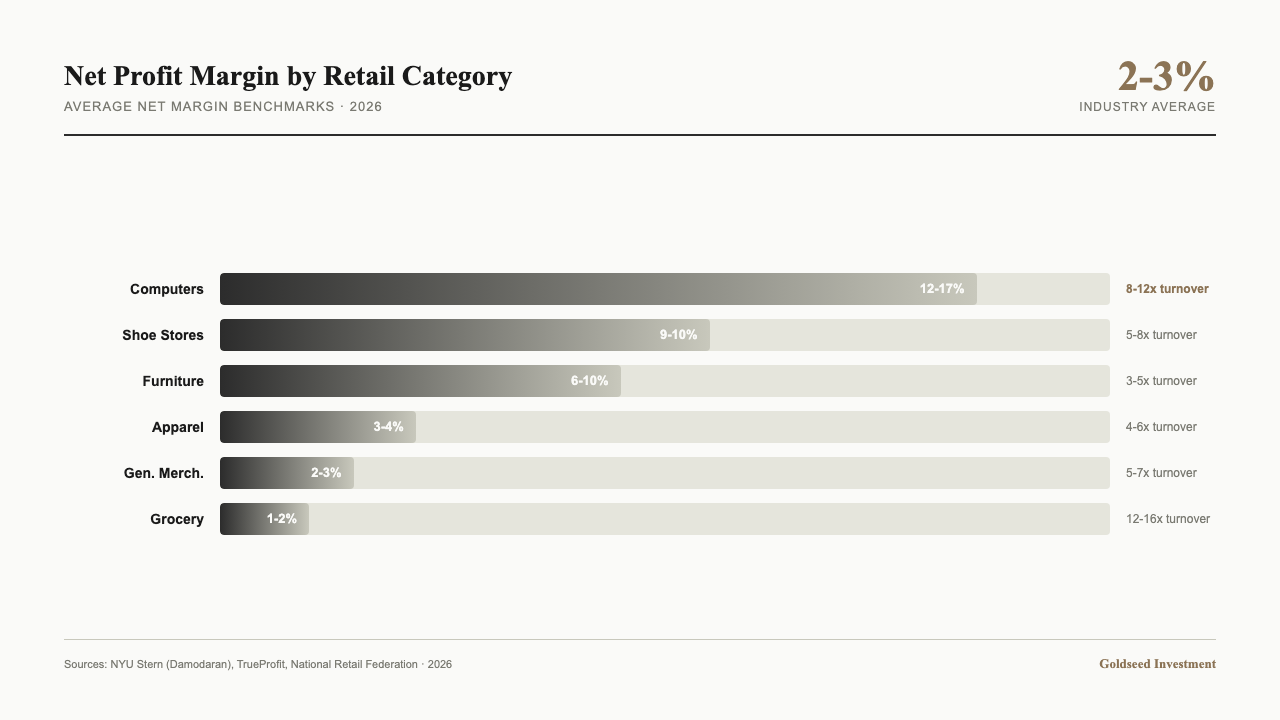
According to NYU Stern’s margin analysis (based on Damodaran’s retail dataset), specialty retail — particularly computers, shoes, and consumer electronics — delivers the strongest margins. Shoe stores maintain net margins around 9.5%, while computer/peripheral retailers push toward 17% net. These categories win because customers research extensively before buying, reducing price sensitivity and enabling higher markups. Inventory turns quickly (8-12 times per year), meaning less working capital tied up.
Furniture and home goods occupy the middle ground, with net profit margins between 6-10%. Turnover is slower (3-5 times annually), but higher average transaction values and category-specific markups support better margins than apparel.
Apparel and general merchandise retail sit at the lower end, averaging 3-4% net margin. Fast fashion, trend-driven inventory, and seasonal markdowns compress margins. Department stores and mall-based retailers operate in this band.
Grocery and food retail operates at the absolute floor: 1-2% net margin according to TrueProfit’s 2026 benchmarks. High inventory shrinkage, perishability, price competition, and rapid inventory turnover (12-16 times per year) leave minimal margin. Grocery operates on volume — a successful store needs significant daily transaction count to hit break-even.
Retail Category Comparison Table
| Category | Average Net Margin | Annual Inventory Turnover | Typical Store Revenue (Annual) |
|---|---|---|---|
| Specialty (Computers) | 12-17% | 8-12x | $800K–$2M |
| Shoe Stores | 9-10% | 5-8x | $600K–$1.2M |
| Furniture & Home | 6-10% | 3-5x | $400K–$1.5M |
| Apparel & Fashion | 3-4% | 4-6x | $500K–$1.2M |
| General Merchandise | 2-3% | 5-7x | $800K–$2M |
| Grocery & Food | 1-2% | 12-16x | $1.2M–$4M |
Source: NYU Stern (Damodaran), TrueProfit, National Retail Federation — data represents medians, not averages. Individual stores vary based on location, rent, and operational efficiency.
Why Your Gross Margin Is 50% but Your Net Margin Is 3%
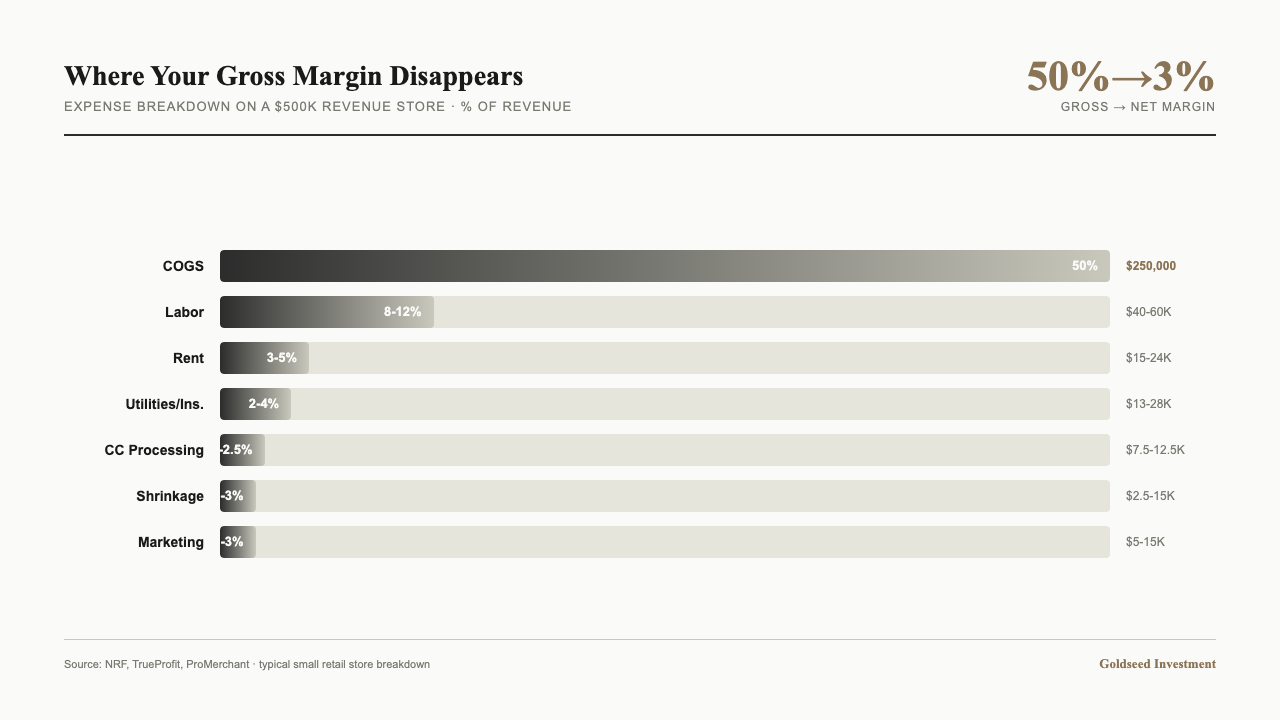
The mathematical collapse from gross to net reveals where retail profitability actually goes. Using a typical $500,000 annual revenue store as reference, here’s the breakdown.
Starting point: $500,000 revenue, 50% gross margin = $250,000 gross profit.
Rent and occupancy: The largest margin killer for small retail. A 1,200-square-foot store in a decent location averages $15,000-$24,000 annually (roughly 3-5% of revenue). Prime locations double this. Poor lease negotiation can consume 8-10% of revenue. Rent doesn’t scale — it’s fixed regardless of sales.
Labor and payroll: This is the variable cost that grows with the business but rarely shrinks. An owner working solo might spend $0 in payable labor. A store with one part-time cashier costs $15,000-$20,000 annually (3-4% of revenue). A store with one full-time employee plus part-time coverage hits $40,000-$60,000 (8-12% of revenue). Over-hiring by even one shift per week costs $15,000-$20,000 per year in wasted labor.
Utilities, insurance, and licensing: Typically 2-4% of revenue. A $500,000 store spends $10,000-$20,000 on utilities, $3,000-$8,000 on general liability and property insurance, and $500-$2,000 on local licensing and permits.
Shrinkage, breakage, and waste: Retail inventory doesn’t convert to sales perfectly. Shoplifting, employee theft, breakage, expiration, and markdown losses typically run 0.5-3% of revenue depending on category. Grocery stores report 2-3%. Specialty retail reports 0.5-1.5%.
Marketing and promotions: Digital marketing, local ads, signage, promotions, and email campaigns consume 1-3% of revenue for most stores. High-competition categories spend toward the higher end.
Credit card processing and payment fees: 1.5-2.5% of revenue if accepting cards (which nearly all do). A store processing $500,000 annually pays $7,500-$12,500 in swipe fees alone.
Miscellaneous: Banking fees, packaging, supplies, repairs, professional services: another 1-2%.
The result: $250,000 gross profit minus $180,000-$200,000 in operating expenses leaves $50,000-$70,000 in operating profit, or 10-14% operating margin. Federal and state taxes take 20-30% of that, leaving net profit of $35,000-$56,000 on a $500,000 revenue store, or 7-11% net margin.
That calculation assumes tight management. Real stores often operate looser. Overstaffed schedules, high rent in poor locations, and promotional overhead can easily drop a $500K store from 10% net to 3-4% net. This is why margin variation is so wide — operational discipline creates 6-8 percentage points of difference.
What Separates a 3% Store From a 10% Store
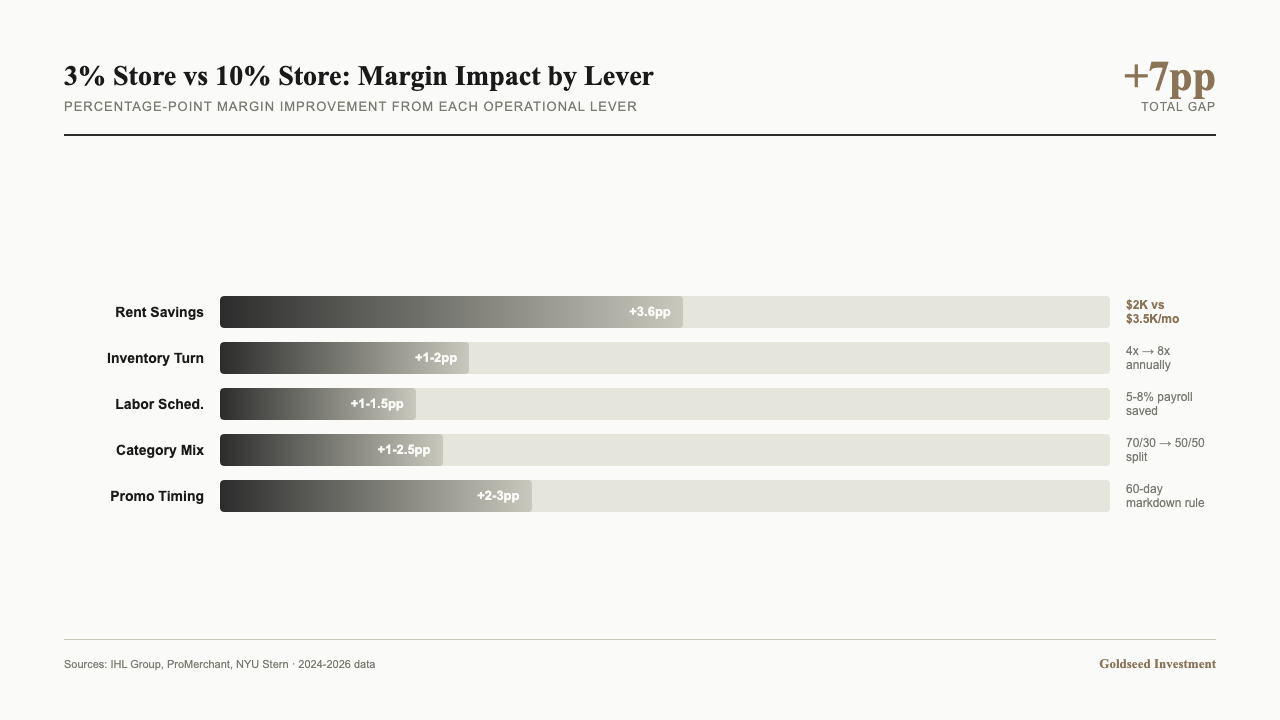
The gap between a struggling store (3% net margin) and a profitable one (10% net margin) rarely comes from merchandise selection alone. It comes from four operational levers that compound.
Inventory turnover efficiency. A store that turns inventory 8 times per year generates roughly $500K from $62.5K in average inventory. A store turning inventory 4 times annually needs $125K in inventory to hit the same sales. That second $62.5K in inventory ties up capital, requires more storage space (higher rent), increases shrinkage risk, and creates markdown pressure. According to IHL Group data, retailers improving turnover from 4x to 8x annually recover 1-2 percentage points of margin through reduced carrying costs and markdowns.
Rent negotiation and location selection. This is binary — you either negotiate hard or you don’t. Comparing rent between a $2,000/month location ($24K annually on a $500K store = 4.8% margin impact) and a $3,500/month location ($42K annually = 8.4% impact) shows a 3.6-percentage-point swing before a single sale is made. Owners who negotiate multi-year rates with 2-3% escalators, seek secondary locations with lower rent, or share space with complementary retailers recover this expense pool.
Labor scheduling discipline. Overstaffing is invisible profit loss. Adding one unneeded shift per week across three months costs $5,000-$8,000 at retail wage rates. A store operating with dynamic scheduling (staffing to foot traffic patterns) versus static scheduling (same bodies regardless of sales velocity) typically saves 5-8% of payroll. This translates directly to margin.
Category selection within your store. If you operate a 70/30 split between low-margin (grocery-style convenience items at 2% net) and higher-margin categories (specialty items at 12% net), your blended margin is 4.4%. If you shift to 50/50, your blended margin jumps to 7%. Some owners never analyze this and accidentally create stores that can’t be profitable at their current rent levels.
Promotional discipline. Stores that mark down excess inventory within 60 days preserve margin better than stores that hold inventory for 6 months hoping to sell it full-price. ProMerchant data shows retailers with quarterly promotions (clearing old inventory) maintain 2-3 percentage points higher margins than retailers promoting continuously.
Frequently Asked Questions
What is a good profit margin for a small retail store?
A net profit margin of 5-10% is considered healthy for small retail. Specialty retailers can reach 10-17%. Anything below 3% signals operational inefficiency or an unfavorable lease. Convenience stores and grocery stores operate at the low end (1-3%) by category design, not necessarily poor management.
What is the difference between gross margin and net margin in retail?
Gross margin is revenue minus cost of goods sold (what you paid for inventory). Net margin is revenue minus all expenses — cost of goods sold plus operating costs like rent, labor, utilities, taxes, and fees. The average retailer has 50%+ gross margin but only 2-3% net margin because operating costs consume most of the gross profit.
Which retail category has the highest profit margin?
Specialty retail — particularly computers and peripherals (12-17% net margin), shoe stores (9-10%), and furniture (6-10%) — maintains the strongest margins. Grocery and food retail operates at the lowest end (1-2% net). Margin hierarchy is driven by inventory turnover speed, price sensitivity, and rent-to-revenue ratios.
How do you calculate net profit margin for a retail store?
Net profit margin = (Net profit ÷ Revenue) × 100. Net profit is revenue minus all operating expenses. For a store with $500K revenue and $500K in revenue minus $480K in total costs leaves $20K net profit, or 4% net margin. Compare this number year-over-year and category-to-category — it’s the only margin metric that matters for profitability.
Why do some retail stores fail even with high sales?
High sales don’t guarantee profitability if rent consumes 8%+ of revenue, labor exceeds 15%, or inventory turnover is slow. A $1M store with 3% net margin generates only $30,000 net profit annually — potentially lower than the owner’s salary requirement. Without monitoring the margin breakdown, owners scale unprofitable business models.
A Framework for Evaluating Retail Opportunities
If you’re evaluating a retail store investment, start with margin data specific to the category. Pull financials from publicly-traded retailers in your target category — Walmart (3.26% net margin as of January 2026 per MacroTrends), Best Buy (4-5%), Dick’s Sporting Goods (7-9%) — and treat those as ceiling benchmarks. Independent stores rarely match public company margins due to scale disadvantages.
Next, run a pro-forma with your specific location rent, staffing model, and category mix. The rent figure is non-negotiable — get competing locations’ rates in writing. Assume labor costs of 10-12% of revenue for a full-time owner-operator with part-time help. Use category-specific shrinkage rates (grocery 2%, specialty retail 1%). Build in 2-3% for marketing.
If your pro-forma shows less than 5% net margin, either negotiate harder on rent, improve your inventory turnover model, or shift into a higher-margin category. This exercise takes 2-3 hours but prevents most retail failures — they’re visible in the numbers before the lease is signed. Learn more about how much revenue your store should generate to justify operational costs.
Start the evaluation with category data, not optimism. The retail store profit margin isn’t a conclusion — it’s a forecast hiding inside cost structures that you can control.