The average retail net profit margin is only 3 percent — and the gap between your revenue and your real profit is almost always hiding in one of four specific cost categories.
Michael Torres ran a home goods store in Austin for four years. Revenue was climbing — up 11 percent in the most recent year. He felt good about it. Then he sat down to prepare for his bank loan renewal and realized he couldn’t explain where the money had gone. His store had generated $840,000 in sales. His bank account was thinner than expected, and he couldn’t trace the gap.
“Revenue felt real,” Michael said later. “But the cash wasn’t there when we needed it.”
This is the central challenge of retail financial analysis for owners: knowing how to analyze retail store profitability — trace from revenue down to real profit — is a skill most owners develop late, often after a financial surprise forces the issue. This guide walks through five practical steps to understand where your store’s money goes, how to do a retail store profitability analysis that’s actually useful, and how to build a monitoring system that catches problems before they compound.
What Are the Three Profit Margins Every Retailer Needs to Know?
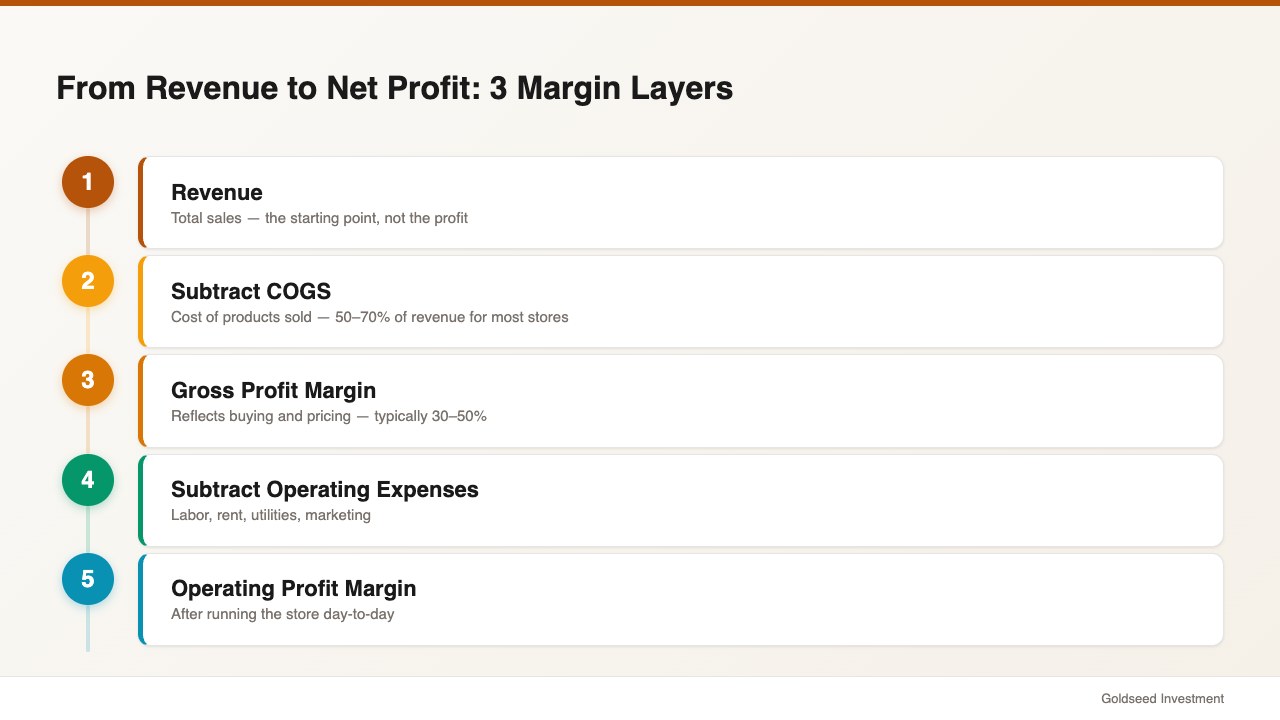
Most stores track revenue. Fewer track gross margin. Fewer still track operating or net margin. But each layer reveals something the others don’t — and retail store profit calculation requires all three.
Gross profit margin measures what you keep after paying for the products you sold. It reflects how well your buying and pricing work together.
Gross Margin = (Revenue – COGS) ÷ Revenue × 100
A store that sells $800,000 worth of merchandise and paid $440,000 wholesale has a gross margin of 45 percent. According to Shopify’s retail profitability framework, gross margins typically sit in the 30–50 percent range for most retail formats. But gross margin alone doesn’t touch payroll, rent, or utilities.
Operating profit margin deducts all operating expenses from gross profit. This is where the gap between “looking profitable” and “being profitable” tends to appear.
Operating Margin = Operating Income ÷ Revenue × 100
A 45 percent gross margin store with $280,000 in operating expenses has roughly a 10 percent operating margin — but many stores face operating costs that consume 30–40 percent of revenue, pushing operating margin into single digits.
Net profit margin is the real number: what you keep after taxes and any interest on debt.
Net Margin = Net Income ÷ Revenue × 100
Industry data from NYU Stern School of Business shows the average retail net profit margin sits around 3 percent — with individual categories ranging from 1.62 percent to over 20 percent. If you’re not tracking net margin monthly as part of your retail store profitability analysis, you may be running near zero without knowing it.
Understanding all three figures together is the foundation of how to measure retail store performance. Without all three, you’re reading only part of the story.
How Do Your Margins Compare to Your Category Benchmarks?
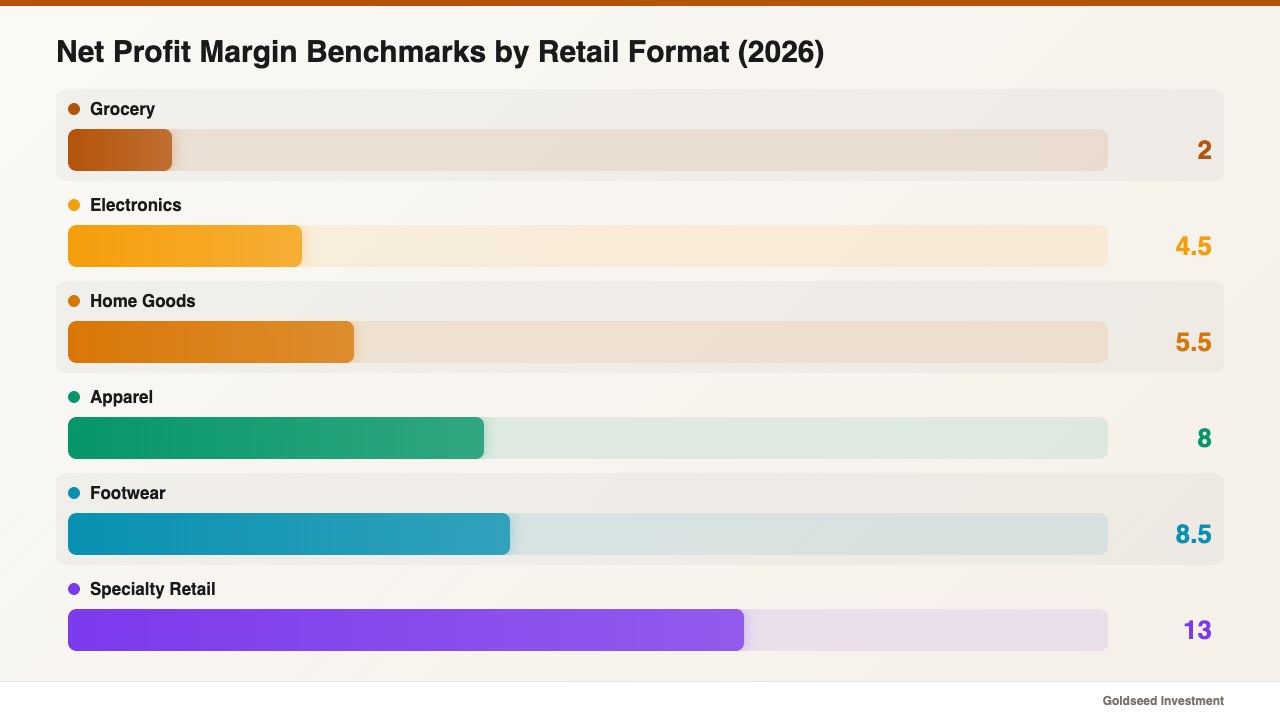
Once you’ve calculated your three margins, you need a reference point. A 4 percent net margin looks very different for a grocery store (above average) versus a specialty gift shop (below average). Context is everything.
Here are 2026 industry benchmarks for retail profitability by format:
| Retail Format | Gross Margin | Operating Margin | Net Margin |
|---|---|---|---|
| Grocery / Convenience | 20–28% | 2–4% | 1–3% |
| Apparel / Clothing | 45–55% | 8–14% | 3–13% |
| Footwear | 40–48% | 10–15% | 7–10% |
| Electronics | 15–30% | 4–9% | 2–7% |
| Specialty / Niche Retail | 35–55% | 10–20% | 8–18% |
| Luxury / Premium | 55–70% | 20–30% | 15–25% |
| Home Goods / Décor | 30–45% | 6–12% | 3–8% |
Source: NYU Stern School of Business, 2024; TrueProfit.io, 2026
If your gross margin sits 8–10 points below your category average, you likely have a COGS or pricing problem. If gross margin is strong but net margin is weak, operating costs are absorbing the difference. Benchmarking tells you which layer to focus on.
A practical habit: do this comparison annually against published data, and quarterly against your own trailing numbers. A store that was at 7 percent net margin two years ago and is now at 3 percent has a trajectory problem worth investigating — even if 3 percent looks acceptable in isolation. The retail store profit margin benchmarks guide offers a detailed breakdown by category including convenience and grocery formats.
Where Are the Cost Leaks in Your Store?
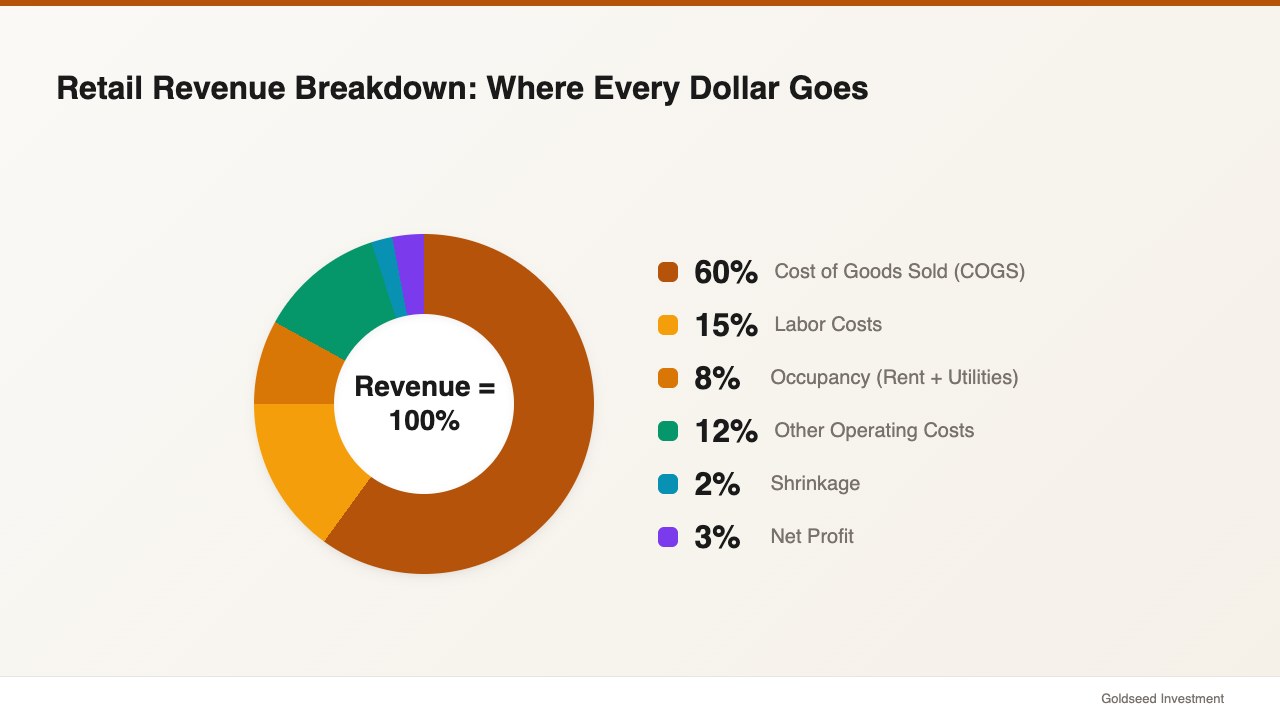
Benchmarks reveal that a problem exists. Tracing cost categories tells you where it is. Four expense categories account for most margin compression in small retail, and this step is central to any effective retail KPI analysis.
Cost of goods sold is the starting point. COGS typically represents 50–70 percent of revenue for most stores. Even a 1-point improvement in your COGS ratio — through better vendor terms, more disciplined ordering, or reduced dead stock — drops directly to gross margin. Track COGS as a percentage of revenue monthly for the past 12 months. An upward trend signals a supplier, markdown, or inventory management issue.
Labor costs typically run 10–20 percent of total operating expenses. The target benchmark for most retail formats is 8–12 percent of revenue. Stores running labor above 18 percent of revenue are usually experiencing overstaffing in slow periods, chronic overtime, or high turnover that triggers constant re-hiring. Labor inefficiency compounds — each dollar of excess labor reduces cash available for inventory and store improvements.
Shrinkage — inventory lost through shoplifting, internal theft, vendor shortfalls, and counting errors — typically runs 1–2 percent of annual revenue. For a store doing $840,000 in sales, 2 percent shrinkage equals $16,800 per year. At a 3 percent net margin, replacing that loss would require generating more than $560,000 in additional revenue. Shrinkage is often the highest-ROI area for operational improvement in stores that haven’t addressed it systematically.
Occupancy costs generally run 5–10 percent of revenue for well-positioned stores. In premium or mall locations they can exceed 12 percent. When occupancy climbs above 10 percent of revenue, maintaining a positive net margin becomes structurally difficult for most store types.
One retail operator managing multiple locations put it plainly: “The data was always there. The problem was nobody had time to clean it. By the time anyone figured out a product wasn’t selling, the cash had already been sitting there for months.”
Most stores have the data to trace their cost leaks — they just haven’t built the habit of reviewing it on a fixed schedule.
How Do GMROI and Inventory Turnover Reveal Hidden Profit?
Inventory is the largest single asset in most retail businesses. It’s also where profitability often hides. Two metrics make inventory profitability analysis practical — and they’re underused by most independent retailers.
Inventory Turnover Rate tells you how many times your inventory sells and replenishes in a given period.
Inventory Turnover = Cost of Goods Sold ÷ Average Inventory Value
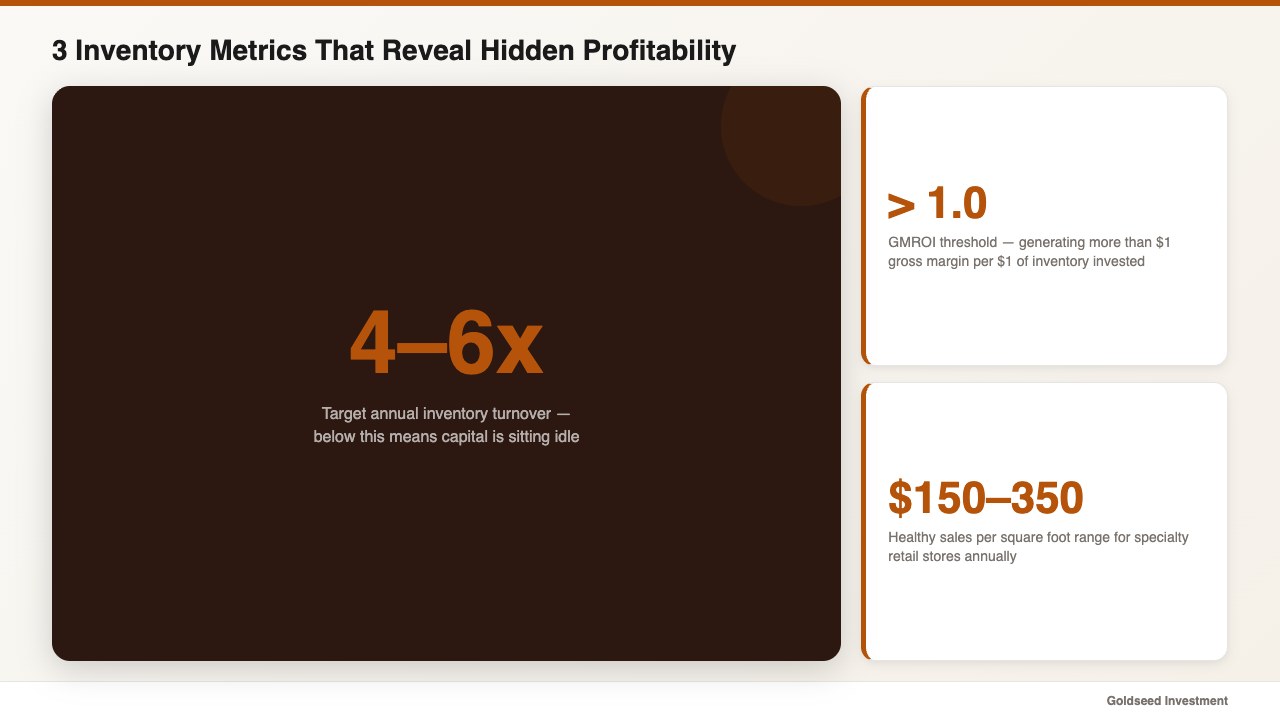
A specialty retailer with $200,000 COGS and $80,000 average inventory has a turnover of 2.5x per year. In most retail formats, 4–6x annually is considered healthy. Low turnover means capital is sitting on shelves rather than cycling. High turnover means strong demand alignment but potential stockout risk if reorder points aren’t calibrated.
Gross Margin Return on Investment (GMROI) takes turnover further by factoring in the margin each product generates.
GMROI = Gross Margin ÷ Average Inventory Cost
According to retail KPI research from Qoblex, GMROI above 1.0 means you’re generating more than $1 of gross margin for every dollar of inventory investment. Below 1.0 means you’re losing ground.
The practical use of GMROI is product-level decision making. A product with 55 percent gross margin but slow turns can have a lower GMROI than one with 30 percent gross margin that sells 8x per year. Ranking your product categories by GMROI tells you where to direct buying dollars — and which categories to reduce or exit.
Sales per square foot is a third metric worth tracking in physical stores.
Sales per Square Foot = Total Revenue ÷ Store Area (sq. ft.)
Industry averages for specialty retail tend to run $150–$350 per square foot annually. The more useful comparison is your own trend over time. A declining sales-per-square-foot figure in a stable-revenue store suggests sales are concentrating in fewer categories while others underperform.
For a walkthrough of how to connect these metrics to your actual financial statements, the guide to creating retail financial statements without an accountant covers the fundamentals in straightforward terms.
How Do You Build a Monthly Profitability Dashboard?
Retail store profitability analysis is only useful if it happens consistently. A monthly dashboard doesn’t need to be sophisticated — it needs to be honest and regular.
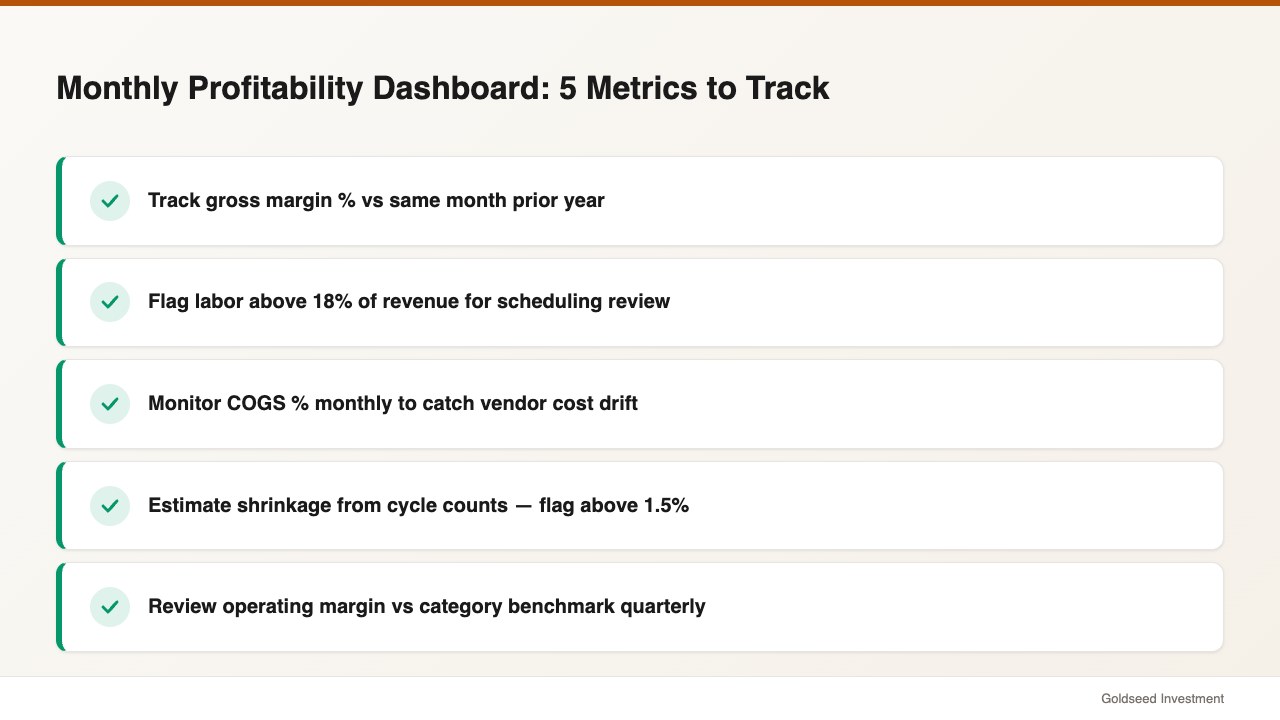
The minimum set of metrics to review each month:
- Gross margin percentage (vs. prior month and prior year same month)
- Labor cost as a percentage of revenue
- COGS as a percentage of revenue
- Shrinkage estimate (from cycle counts or inventory reconciliation)
- Operating margin (gross margin minus all operating expenses as percent of revenue)
Track each metric in a simple spreadsheet with a prior-year same-period comparison column. Seasonal businesses should always compare to the same month one year ago, not to the prior month.
Set alert thresholds for each metric. For example:
- Gross margin drops more than 3 points from the same period last year → investigate COGS or pricing
- Labor exceeds 18% of revenue → review scheduling and overtime
- Shrinkage estimate exceeds 1.5% → run a cycle count
- Net margin below 2% for two consecutive months → full P&L review
This is what retail financial analysis for owners actually looks like in practice: not a once-a-year accounting exercise, but a monthly habit with defined thresholds. Most margin problems that reach crisis level began as slow trends that went unnoticed for 6–12 months.
For context on how other store owners approach the P&L — including common patterns in the convenience store format — the convenience store P&L benchmarks guide covers monthly reporting structures that apply across most small retail formats.
What Mistakes Undermine Retail Profitability Analysis?
Understanding the five steps is more useful when you know which errors tend to derail the process.
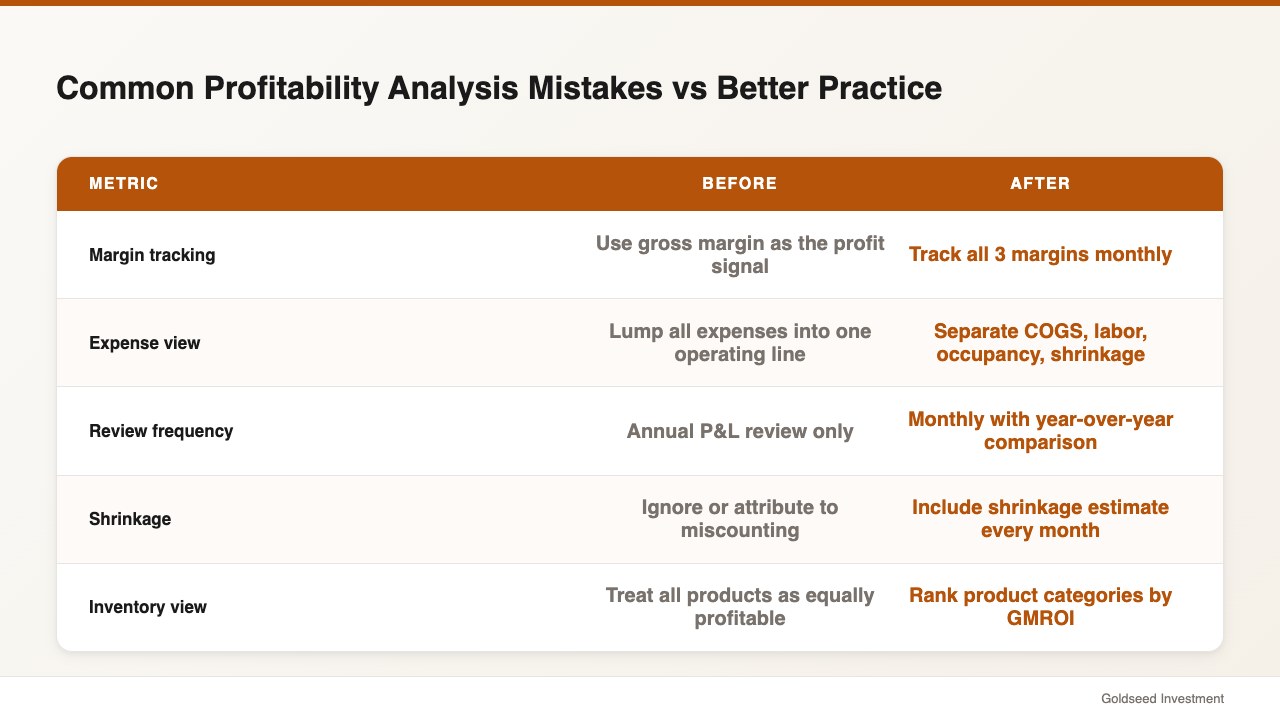
Confusing gross margin with profitability. A 48 percent gross margin says nothing about whether the store is making money. Every dollar of gross margin can be consumed by operating costs before you see net income. Gross margin is a starting condition — not a result.
Not separating cost categories. Grouping all expenses into “operating costs” makes it impossible to identify whether a margin problem is a labor issue, a rent issue, or a marketing issue. Category separation is the foundation of useful analysis. This is the core of any meaningful retail KPI analysis guide: separate, then compare.
Reviewing profitability only annually. An annual review finds problems after they’ve already compounded. Monthly reviews let you respond within the same quarter. The first time many store owners see their annual P&L and discover a margin issue, they realize the trend started 8–10 months earlier. Monthly tracking closes that gap.
Ignoring shrinkage in the cost structure. Shrinkage doesn’t appear on a standard income statement — it shows up as a discrepancy between what was ordered and what sold, which many owners attribute to miscounting. Building a rough shrinkage estimate into your monthly review keeps it from hiding in the background.
Treating all inventory as equally profitable. Dead stock — products that aren’t selling — doesn’t show as a cost on your P&L until you markdown or write it off. But it ties up cash that could be turning over in higher-margin products. GMROI analysis makes this visible; a standard income statement does not.
FAQ

Q: How do I know if my retail store is actually profitable? A: Calculate your net margin: divide net income by total revenue. If net margin is above 3–4 percent for most non-grocery retail formats, you’re in viable territory. Below 2 percent net margin, you’re vulnerable to any cost increase or sales dip. Track this monthly — a single annual number hides seasonal patterns and late-emerging trends.
Q: What profit margin should a small retail store aim for? A: For most small specialty and niche stores, a gross margin of 40–50 percent and a net margin of 5–10 percent tends to reflect healthy, sustainable operations. Convenience and grocery stores run at lower net margins (1–3 percent) due to volume-based models. Use the benchmark table in Step 2 as your reference — the category comparison matters more than any single number.
Q: How often should I do a profitability analysis? A: Review gross margin and labor cost monthly. Run a full five-step retail store profitability analysis quarterly. Benchmark against industry data annually. The higher the frequency, the earlier you catch problems and the lower the cost of fixing them.
Q: What’s the difference between profitability analysis and just reading a P&L? A: A P&L shows you the numbers. Profitability analysis interprets what those numbers mean relative to your category, your trend, and your cost structure. Reading a P&L tells you what happened. Profitability analysis tells you why it happened and what to do about it. The five steps in this guide are the interpretive layer that makes a standard P&L actionable.