Convenience stores lose an average of 1.8–2.5% of annual sales to inventory shrinkage — more than any other retail format. Operators who drop their convenience store shrinkage percentage from 2.5% to below 1% recover the equivalent of $15,000 to $45,000 per year, depending on store revenue.
Maria Chen runs a single convenience store in suburban Texas. For three months straight, her actual gross margin came in 1.8 percentage points below what the POS system projected. She wasn’t overspending. She wasn’t pricing wrong. The numbers simply didn’t add up — and she had no way to trace where the gap was coming from.
If this sounds familiar, it’s not because you’re running your store carelessly. Convenience stores face a structural c-store inventory loss problem that most other retail formats don’t. The product mix, the operating hours, the transaction volume — all of it creates conditions where losses accumulate faster and stay invisible longer.
This guide walks through what the data actually shows for convenience store inventory shrinkage rates in 2026, what causes those losses, and what high-performing operators do differently.
What Is Inventory Shrinkage — and Why Does It Hit Convenience Stores Hard?
Inventory shrinkage is the difference between what your records say you should have and what’s actually on the shelf. It’s measured as a percentage of net sales:
Shrinkage % = (Recorded Inventory Value − Actual Inventory Value) ÷ Net Sales × 100
A store recording $800,000 in annual sales with $16,000 in unaccounted inventory loss has a 2% shrinkage rate. That number sounds small. At a 30% gross margin, that $16,000 in shrinkage represents roughly $53,000 in sales you needed to generate just to break even on the loss.
Convenience stores tend to have higher shrinkage than most retail formats for three structural reasons. First, the product mix leans heavily toward high-theft SKUs: tobacco, alcohol, energy drinks, and prepaid cards are among the most frequently stolen items in any retail environment. Second, the operational model — extended hours, lean staffing, high transaction volume — creates more opportunities for both external theft and internal discrepancies. Third, convenience stores often carry prepared food and perishables, which add a separate layer of food waste shrinkage that doesn’t apply to dry-goods-only retailers.
What Is the Average Convenience Store Shrinkage Rate in 2026?
The National Retail Federation’s 2024 Retail Security Survey pegs overall retail shrinkage at 1.6% of total retail sales — translating to $112.1 billion in losses industry-wide. Convenience stores tend to run above that average.
Based on industry data and operator benchmarks compiled through 2025 and updated for 2026, the ranges look like this:
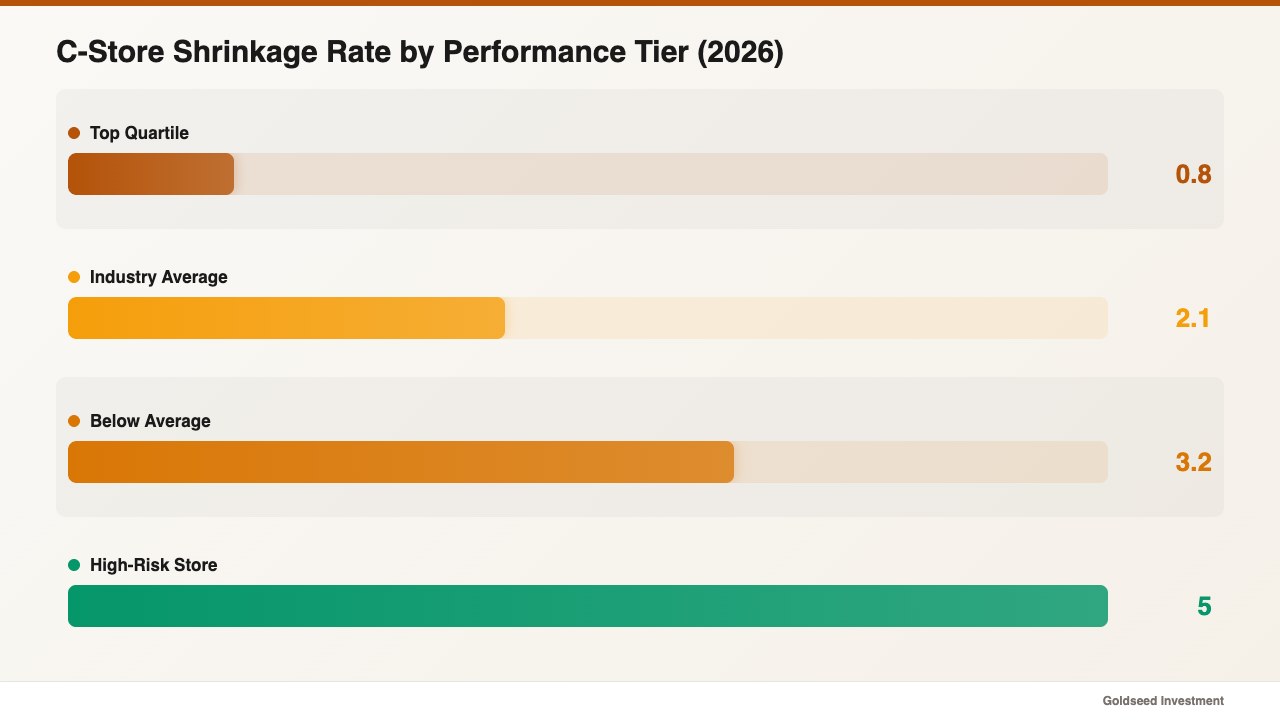
| Performer Tier | Shrinkage Rate | Annual Loss at $1M Revenue |
|---|---|---|
| Top quartile (best-in-class) | < 1.0% | < $10,000 |
| Industry average (c-store specific) | 1.8%–2.5% | $18,000–$25,000 |
| Below average | 2.5%–4.0% | $25,000–$40,000 |
| High-risk / problem store | > 4.0% | > $40,000 |
Source: NRF 2024 Retail Security Survey; NACS State of the Industry 2024
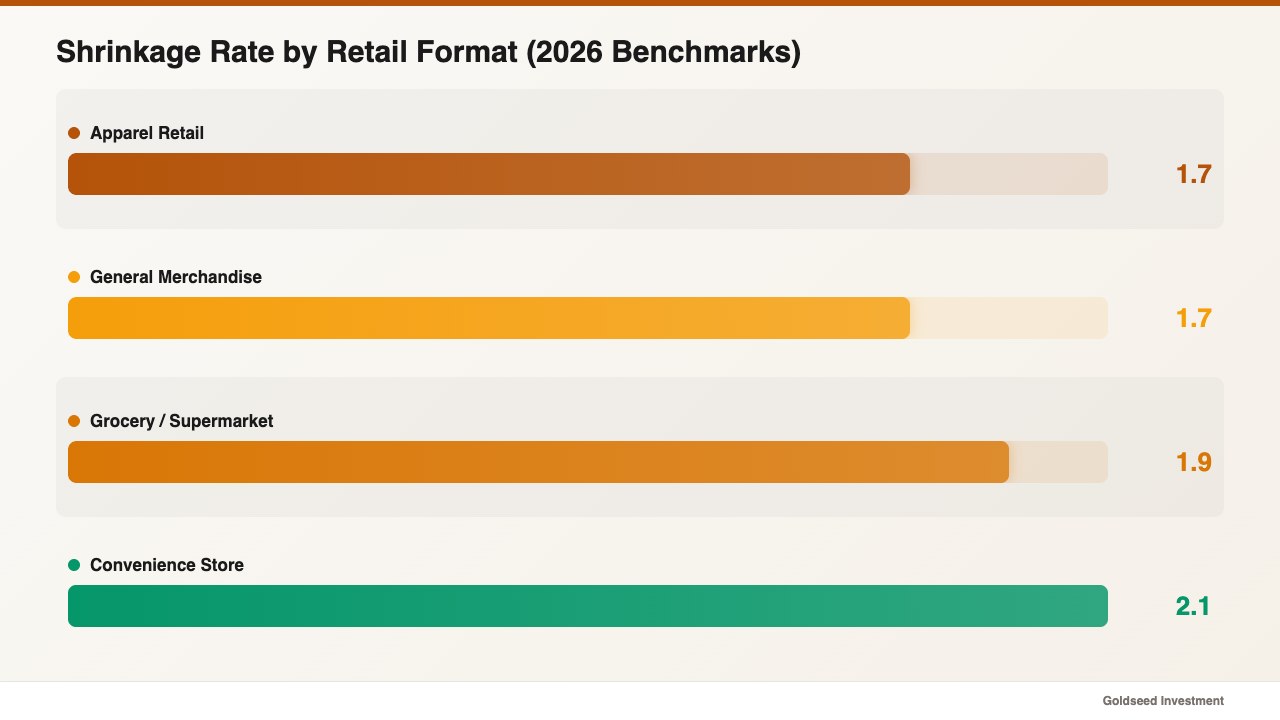
For context, grocery stores typically run shrinkage of 1.5–2.0%. Apparel retail runs 1.4–2.0%. General merchandise sits closer to 1.5–1.8%. Convenience stores sit at the higher end of the spectrum — not because c-store operators are less careful, but because the format is structurally more exposed.
The $1M revenue example above is close to the NACS median for single-location convenience stores. If your store does $800K annually and runs at 2.5% shrinkage, you’re absorbing $20,000 in inventory losses per year. That’s more than many c-store operators take home as net profit in a quarter.
Understanding where you sit relative to average retail shrinkage benchmarks is the starting point for any meaningful loss reduction effort.
Why Do Convenience Stores Have Higher Shrinkage Than Other Retail Formats?
Several factors converge to make c-stores structurally more vulnerable to shrinkage:
Product concentration in high-theft categories. Tobacco products, alcohol, and energy drinks are among the highest-shrinkage SKUs in any retail setting. These products are small, high-value, and easy to conceal. A convenience store carrying a full tobacco wall and a cooler of 24-packs carries more shrinkage risk per square foot than a comparable clothing store.
Operating hours and staffing ratios. A store open 18–24 hours per day with one or two employees per shift creates conditions where monitoring is limited. Deterrence drops during overnight hours, and with fewer eyes on the floor, both shoplifting and employee theft opportunities increase.
Cash transaction volume. Despite the growth of card payments, convenience stores still handle more cash transactions than most retail formats. Higher cash volume means more reconciliation gaps, more register discrepancies, and more points where small amounts can disappear without leaving a clear record.
Food service shrinkage. Prepared food, hot dogs on rollers, coffee stations — these categories carry their own shrinkage layer that has nothing to do with theft. Unsold prepared items, food that spoils before its use-by date, and portioning inconsistencies can add 3–8% shrinkage on perishable categories alone, according to Food Marketing Institute research. This often gets buried in the overall shrinkage number and never gets addressed separately.
Vendor delivery complexity. High-frequency deliveries from multiple vendors — DSD (direct store delivery) distributors for beverages, tobacco reps, snack distributors — means more opportunities for delivery discrepancies that go unverified. A case of energy drinks short by two cans, multiplied across dozens of deliveries per month, adds up. Operators who catch these discrepancies report recovering 0.2–0.4 percentage points of shrinkage through vendor reconciliation alone.
What Are the 4 Causes of Convenience Store Shrinkage?
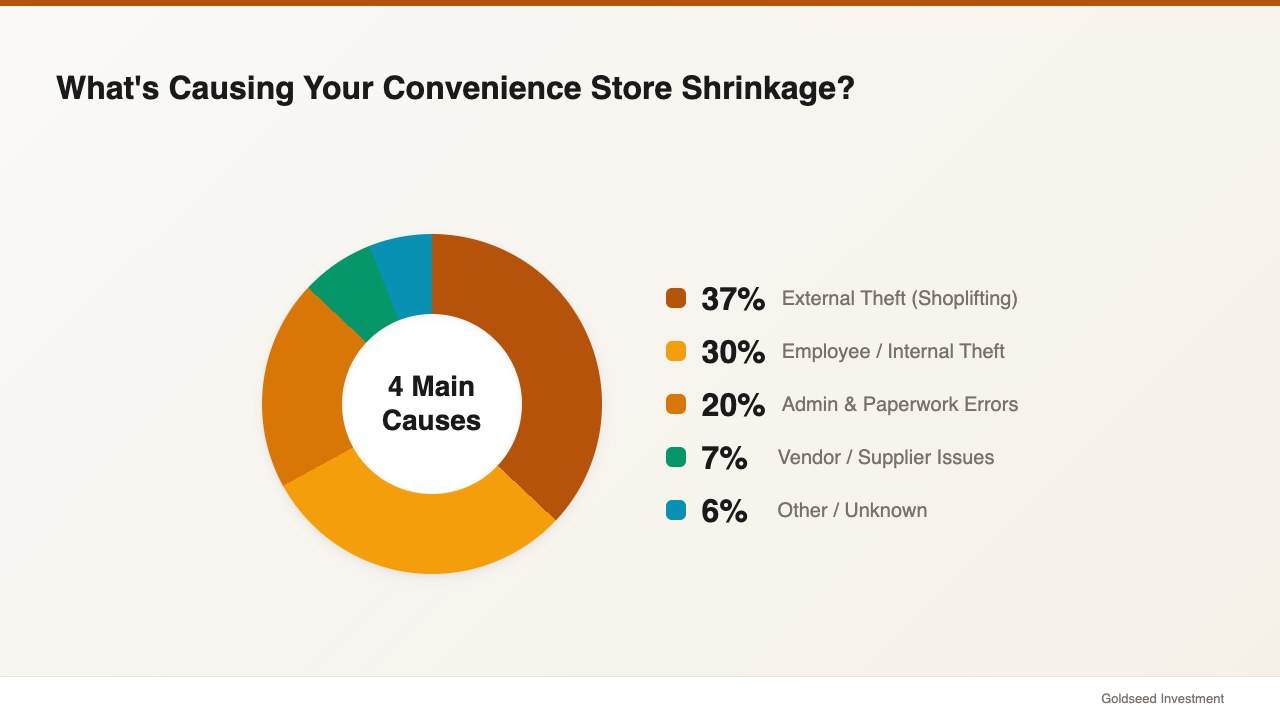
Loss prevention research consistently shows four main categories driving retail shrinkage. The proportions below reflect data from the NRF 2024 Retail Security Survey and the Hayes International Global Retail Theft Barometer:
| Cause | Share of Shrinkage | At $20K Total Annual Loss |
|---|---|---|
| External theft (shoplifting) | 35–38% | $7,000–$7,600 |
| Employee / internal theft | 28–33% | $5,600–$6,600 |
| Administrative / paperwork errors | 18–21% | $3,600–$4,200 |
| Vendor / supplier discrepancies | 5–8% | $1,000–$1,600 |
Source: NRF 2024 Retail Security Survey; Hayes International / Checkpoint Systems
A few things tend to surprise c-store operators when they first see this breakdown.
External theft accounts for more than a third of losses — but it rarely feels that way because individual incidents are small. An energy drink pocketed during a busy lunch rush doesn’t register the same way a $200 item going missing does. The cumulative impact, however, is substantial.
Administrative errors are almost always underestimated. Receiving a case of 24 units when you were billed for 24 but only received 22 — and not catching it at the dock — shows up as shrinkage at month-end. Pricing overrides entered incorrectly, damaged goods not processed through a write-off, seasonal markdown errors — these paper losses can account for nearly a fifth of total shrinkage without any theft involved at all.
One retail operator who tracks inventory down to the SKU level described the administrative error problem plainly: “Before, when numbers didn’t match, I had no way to know if it was theft, a counting error, or a receiving mistake. Every discrepancy looked the same on the P&L — just a hole in the margin.”
Which Product Categories Drive the Most Shrinkage in a Convenience Store?
Not all shrinkage is distributed evenly across your product mix. In most convenience stores, a small number of categories tend to drive a disproportionate share of losses.
Tobacco and tobacco accessories. Cigarettes, vaping products, and accessories are high-value, small, and frequently targeted. In many states, tobacco products represent 25–40% of a c-store’s gross sales — and they attract both external theft and employee misappropriation at higher rates than most categories.
Alcohol. Beer and wine — especially single-serve cans — are frequently targeted for concealment. Multi-pack theft (opening a 12-pack to take cans individually) creates losses that don’t show up clearly until a full inventory count.
Energy drinks and carbonated beverages. According to the Loss Prevention Research Council, high-velocity, low-cost items like energy drinks and single-serve beverages account for more than 60% of theft incidents at convenience stores despite lower per-unit value. Volume makes them disproportionately significant in aggregate.
Prepared and hot food. Food service categories tend to have the highest shrink rate of any c-store category — not primarily from theft, but from spoilage and over-production. Unsold hot food discarded at the end of shift, coffee that gets poured after the hold period, food service items prepared but not sold — these represent real margin losses that in many cases go untracked because they’re handled informally.
Candy, snacks, and single-serve items. Low price point, no packaging security, and high transaction volume make these categories prime targets for what loss prevention professionals call “casual theft” — items taken opportunistically rather than deliberately.
A practical approach is to calculate a shrinkage percentage for each major category separately rather than tracking an overall store number only. A store with 0.5% shrinkage on beverages and 6% on prepared food has a very different problem set than one running 2% uniformly across categories. Operators who shift to category-level tracking typically identify the primary loss driver within 60 days and reduce overall shrinkage by 0.5–1.0 percentage points within six months.
How Do Top-Performing C-Stores Keep Shrinkage Below 1%?
The operators who maintain shrinkage below 1% don’t necessarily have better staff or better neighborhoods. They tend to have better processes for making inventory discrepancies visible early — before small gaps compound into significant losses.
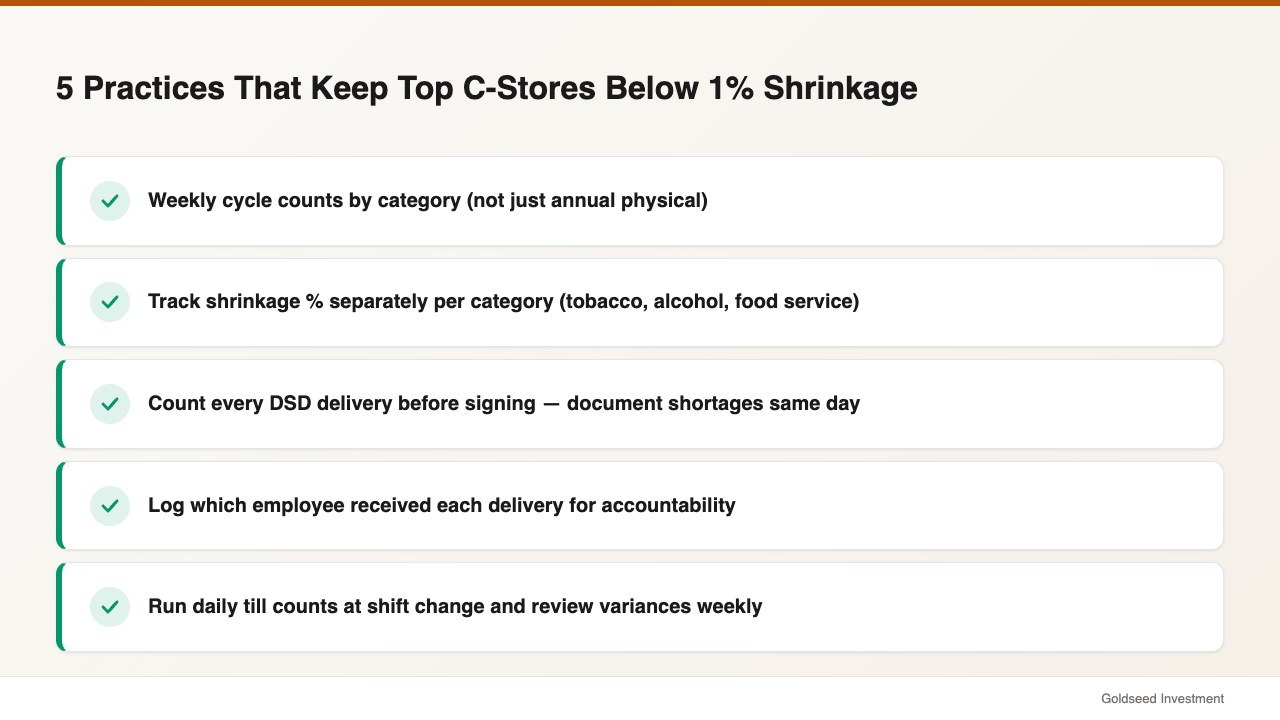
Weekly cycle counts instead of annual physical inventory. A single annual count tells you what your shrinkage was for the year, but gives you no ability to course-correct. Weekly cycle counts — rotating through different categories each week so every product gets counted at least monthly — surface discrepancies while they’re still small. Stores that move from annual to weekly cycle counts often see their shrinkage drop from 2.5% to below 1.2% within a year. For a full guide on running efficient counts, see how to do a stock count efficiently in retail.
Category-level shrink tracking. Store-level shrinkage figures mask what’s actually happening. Breaking shrinkage out by category (tobacco, alcohol, food service, beverages, snacks) lets you identify which specific area needs attention rather than adjusting procedures across the board.
Delivery verification as a standard process. DSD vendors deliver frequently, and delivery shortages are common. Operators who count every delivery before signing — and who document discrepancies immediately — recover a meaningful portion of the vendor/supplier shrinkage category over time. One count logged as short, followed up with the vendor within 24 hours, often gets corrected. The same discrepancy left unaddressed six months in a row becomes accepted loss.
Shift-level receiving logs. Knowing which employee received which delivery creates accountability that doesn’t exist when receiving is done informally. If a discrepancy shows up in a category, having shift-level records of who processed which delivery narrows down the range of causes significantly.
Access controls and shift accountability. This doesn’t require sophisticated technology. Consistent procedures around back-stock access, till counts at shift change, and manager review of daily variances create conditions where both errors and theft are more likely to be caught quickly.
Understanding what’s driving your retail store profit margin requires separating operational shrinkage from theft-driven shrinkage — the solutions for each are completely different.
What Does a 2% Shrinkage Rate Actually Cost Your Convenience Store Each Year?
The percentage makes shrinkage feel like a minor issue. The dollar figures tend to reframe it.
| Annual Revenue | 1% Shrinkage | 2% Shrinkage | 3% Shrinkage |
|---|---|---|---|
| $500,000 | $5,000 | $10,000 | $15,000 |
| $800,000 | $8,000 | $16,000 | $24,000 |
| $1,000,000 | $10,000 | $20,000 | $30,000 |
| $1,500,000 | $15,000 | $30,000 | $45,000 |
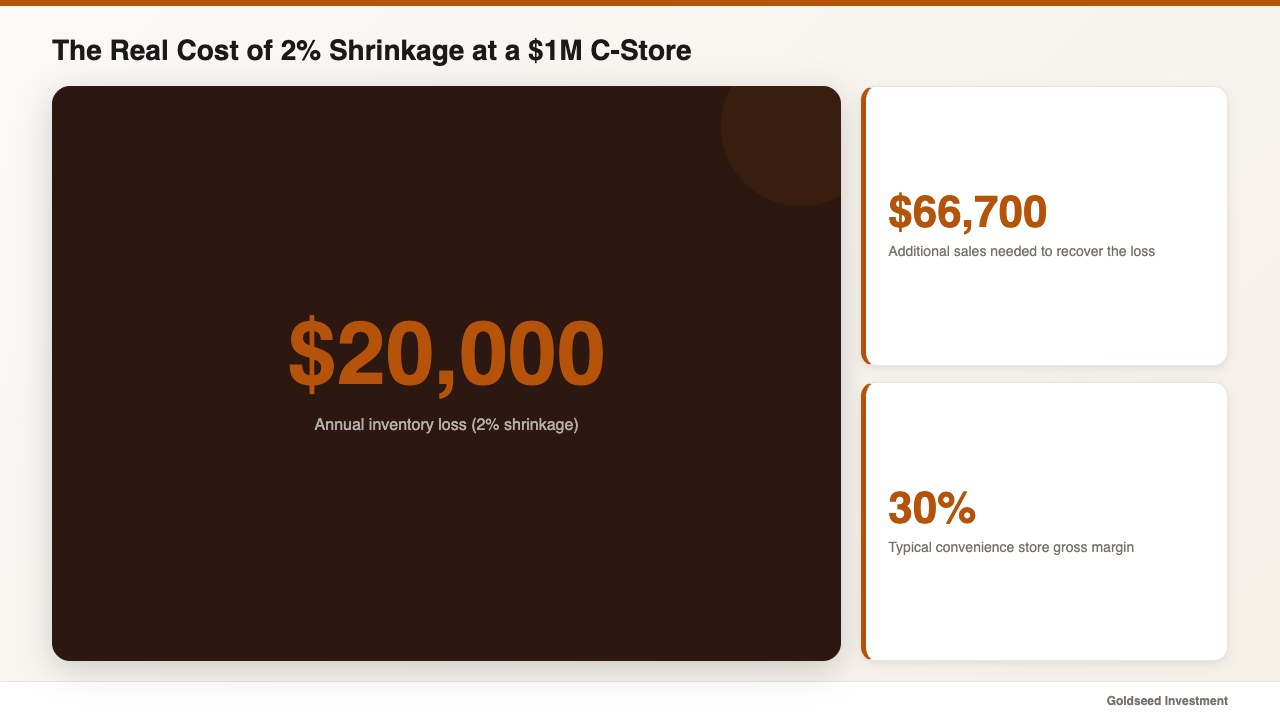
But the dollar loss is only part of the picture. Shrinkage reduces gross margin, not just revenue. At a typical c-store gross margin of 30%, every dollar of shrinkage requires roughly $3.33 in additional sales to generate equivalent profit.
This means a $1M revenue store running 2% shrinkage ($20,000 in losses) needs to generate an additional $66,700 in sales just to recover what shrinkage erases. For a store already operating on thin margins, that’s a significant headwind.
The math also means that reducing shrinkage by even one percentage point — from 2% to 1% — delivers the same bottom-line effect as generating $33,300 in new sales. For most single-location operators, shrinkage reduction is a faster path to improved profitability than growing the top line.
Maria Chen’s store, after implementing weekly cycle counts and category-level tracking in late 2025, reduced overall shrinkage from 2.6% to 1.1% within eight months — a drop that translated to $11,700 in recovered margin on an $800K annual revenue base.
FAQ
Q: What is a good shrinkage rate for a convenience store?
A: Best-in-class convenience stores maintain shrinkage below 1% of sales. Industry average for c-stores sits between 1.8% and 2.5%. Anything above 3% suggests a specific problem — either a high-theft category going unaddressed, a receiving process with gaps, or an internal accountability issue worth investigating. If you’re above 2.5%, category-level shrinkage tracking is the fastest way to identify where losses are concentrating.
Q: How often should I do inventory counts at my c-store?
A: Annual physical inventory counts are the minimum — but they’re far less effective than monthly or weekly cycle counts. Top-performing c-stores rotate cycle counts through their product categories weekly, ensuring every product is counted at least once a month. This approach catches discrepancies while they’re still small and makes it possible to connect a loss to a specific delivery, shift, or time window. Once-a-year counts tell you the damage; regular cycle counts let you prevent it.
Q: Is employee theft or shoplifting the bigger problem in a convenience store?
A: External theft (shoplifting) accounts for a larger share — roughly 35–38% of total shrinkage versus 28–33% for employee/internal theft, according to NRF 2024 data. However, the two categories require different responses, and in many cases administrative errors (18–21% of shrinkage) are actually easier to address first because they don’t require confrontation or surveillance — just better receiving and recording processes. Most operators see the fastest shrinkage improvement by fixing administrative gaps before investing heavily in anti-theft measures.
Q: How do I calculate my convenience store shrinkage rate?
A: The formula is: Shrinkage % = (Recorded Inventory Value − Actual Inventory Value) ÷ Net Sales × 100. Apply it by taking your recorded inventory value at the start and end of a period (adjusted for purchases), then subtracting your actual physical count value. Divide the difference by net sales for the period. Most operators calculate this monthly at minimum. Running it by category rather than store-wide gives a much clearer picture of where losses are coming from.