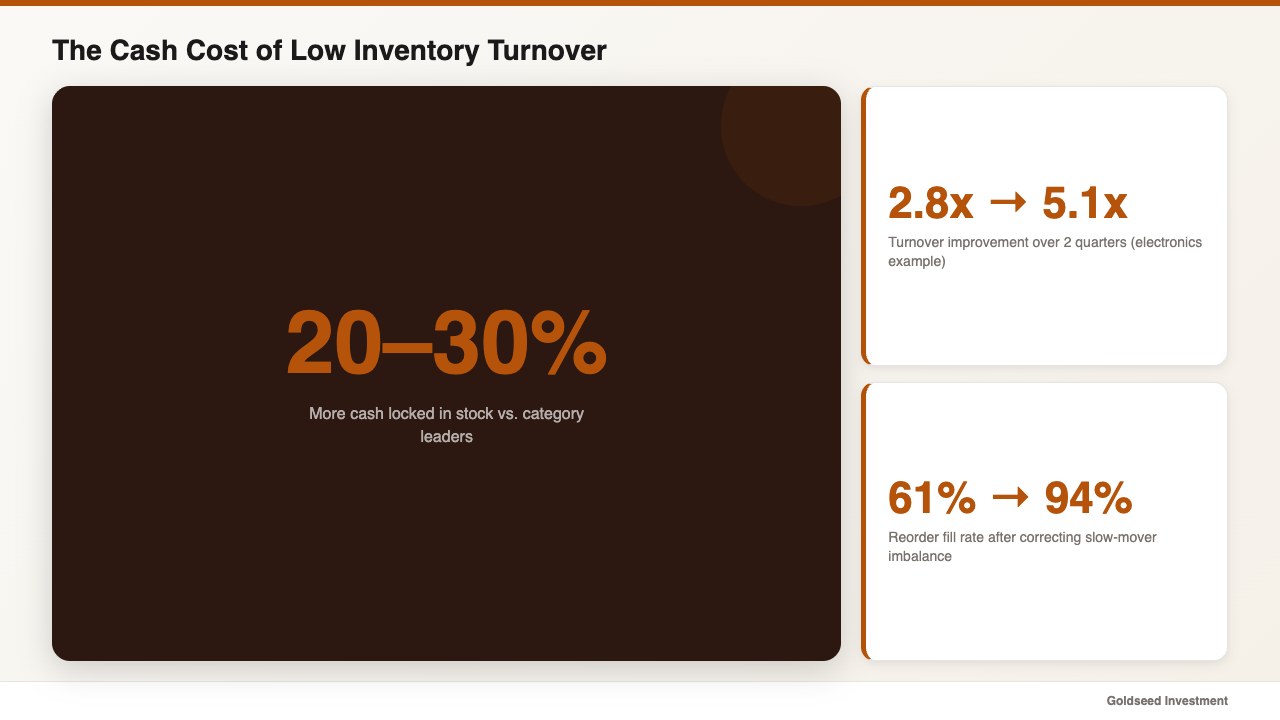
Retailers with an inventory turnover ratio below 4x tend to have 20–30% more cash tied up in unsold stock than their best-performing competitors — a gap that compounds into real margin pressure every single quarter.
Marcus ran three electronics and accessories stores in Texas and thought his numbers were fine. Revenue was growing. Customers kept coming back. But every month, his accountant flagged the same problem: cash was tight, reorders for his bestsellers kept getting delayed, and a third of his shelving space was occupied by accessories he hadn’t moved in four months. His retail inventory turnover rate was sitting at 2.8x — and days inventory outstanding was running 130 days. The category benchmark for electronics sits between 4x and 6x, or roughly 61–91 days on hand. That gap was costing him real money, not in any single dramatic way, but slowly, every week, in storage costs, missed reorder cycles, and margin lost to eventual markdowns.
After running a category-level audit and adjusting reorder points, Marcus brought his electronics accessories turnover from 2.8x to 5.1x over two quarters — and cut days inventory outstanding from 130 days to 72 days. Working capital freed up by that shift covered three months of reorder cycles without touching his credit line.
Understanding the inventory turnover ratio retail stores rely on is one of the most practical financial skills an owner can develop. This guide covers the formula, benchmarks for 2025 and 2026 by category, the risks on both ends of the spectrum, and five ways to move the number in the right direction.
What Is the Retail Inventory Turnover Rate — and Why Does It Matter?
The retail stock turnover rate measures how many times a store sells and replaces its entire stock over a given period — usually one year. A ratio of 8x means the store cycles through its full inventory eight times annually, or roughly every 46 days.
The formula is straightforward:
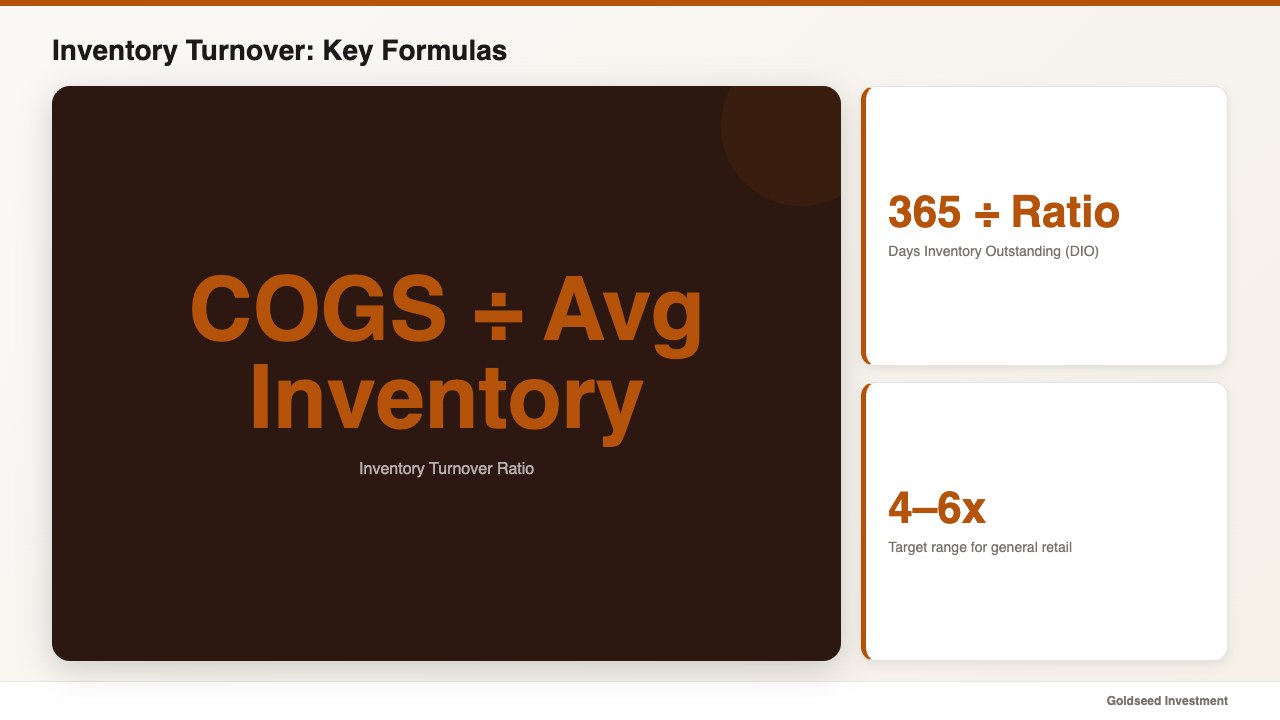
Inventory Turnover Ratio = Cost of Goods Sold (COGS) ÷ Average Inventory
Where average inventory is calculated as:
(Beginning Inventory + Ending Inventory) ÷ 2
A companion metric, Days Inventory Outstanding (DIO) — also called inventory days on hand retail operators commonly reference — converts the ratio into something more intuitive:
DIO = 365 ÷ Inventory Turnover Ratio
A ratio of 8x translates to roughly 46 days of inventory on hand at any given time. A ratio of 3x means stock sits for an average of 122 days before it sells. According to Shopify’s retail guide, most general retailers should aim for 4–6 inventory turns per year as a starting benchmark, though this varies substantially by category.
Why does this matter beyond accounting hygiene? Because inventory is cash that hasn’t moved yet. Every dollar sitting on a shelf is a dollar that isn’t paying a vendor, covering payroll, or funding the reorder of something that’s actually selling. Retail profit margin analysis often focuses on revenue and COGS, but inventory turnover sits underneath all of it — it tells you whether the capital embedded in your stock is working hard or sitting idle.
Low turnover typically suggests one of three things: the store is overstocked on slow sellers, pricing isn’t moving product, or purchasing patterns aren’t aligned with actual demand. Each of these tends to show up in cash flow long before it shows up in a profit and loss statement.
How Do You Calculate Inventory Turnover for a Retail Store?
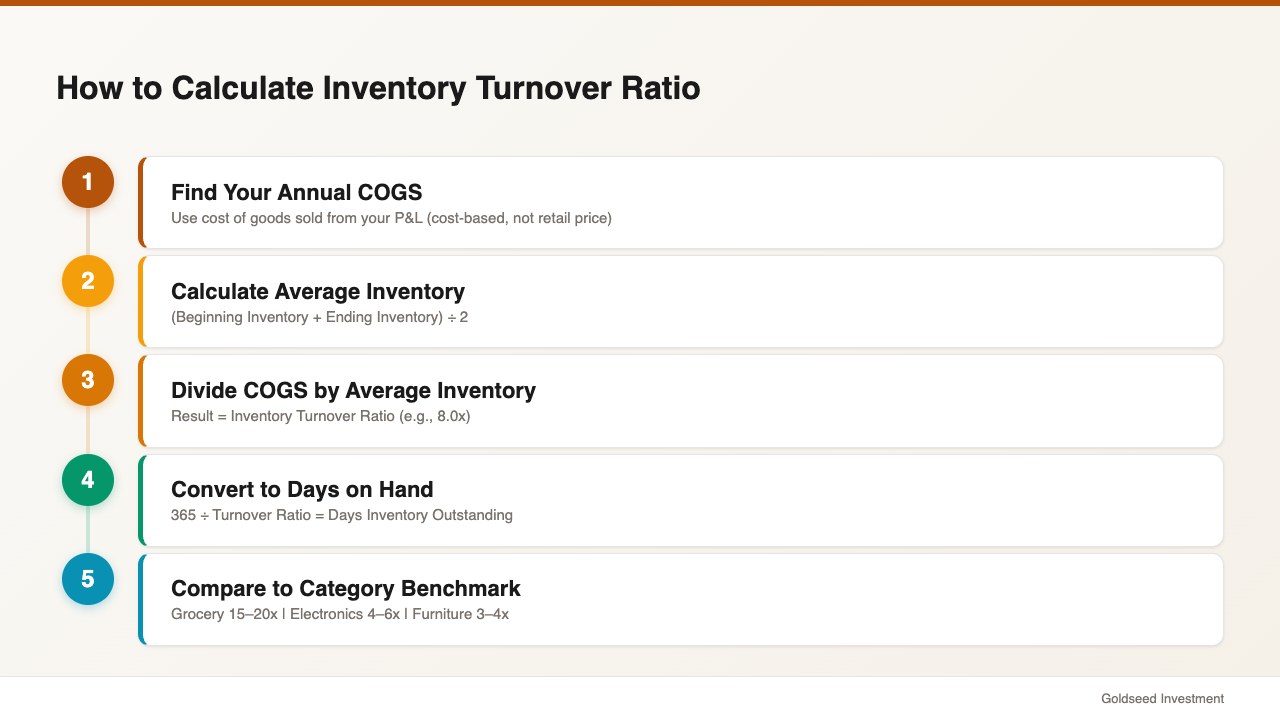
The calculation is simple when you have clean records. Knowing how to calculate inventory turnover accurately starts with making sure both inputs use cost-based values, not retail price. Here’s a step-by-step example:
Inputs:
- Annual COGS: $480,000
- Beginning inventory (at cost): $55,000
- Ending inventory (at cost): $65,000
Step 1 — Average Inventory: ($55,000 + $65,000) ÷ 2 = $60,000
Step 2 — Turnover Ratio: $480,000 ÷ $60,000 = 8.0x
Step 3 — Days Inventory Outstanding: 365 ÷ 8 = ~46 days
This store moves through its full inventory stack every 46 days. For most general retail categories, that’s a healthy position.
A few practical notes on getting accurate inputs:
- Use cost, not retail price. Both COGS and inventory should be valued at cost. Mixing retail price for inventory with COGS will distort the ratio significantly.
- Match the time period. If you’re calculating for a quarter rather than a full year, use quarterly COGS and calculate days as 91 ÷ ratio instead of 365 ÷ ratio.
- Calculate by category, not just store-wide. A blended ratio of 7x might look healthy while hiding one category sitting at 2x and dragging cash flow. Most inventory problems are category-level problems, not store-level ones.
One operator managing multiple locations described it plainly:
> “It wasn’t carelessness. With 4,000 SKUs, there’s no human way to track every product’s rhythm. I needed a system that does the math — I just needed to approve the order.”
That gap between gut feel and actual data tends to show up first in turnover ratios, often months before it surfaces in revenue numbers.
What Is a Good Inventory Turnover Rate by Retail Category?
Benchmarks vary widely by product type, margin profile, and customer purchase frequency. Comparing a grocery store’s 18x to a furniture store’s 3.5x isn’t useful — what matters is how your ratio compares to stores in your own category.
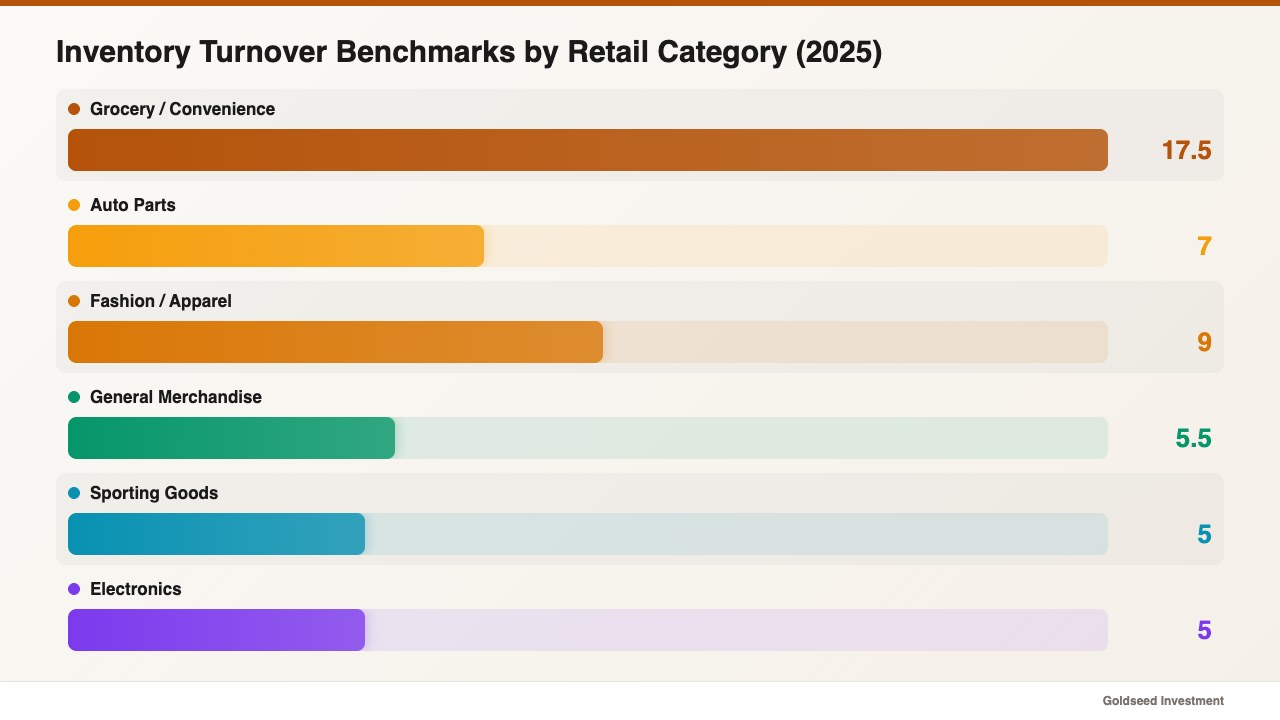
According to Netstock’s industry benchmark data and Onramp Funds’ 2025 analysis, these ranges represent current performance across major retail categories:
| Retail Category | Average Turnover (2025) | Days on Hand |
|---|---|---|
| Grocery / Convenience | 15–20x | 18–24 days |
| Fashion / Apparel | 6–12x | 30–61 days |
| Electronics | 4–6x | 61–91 days |
| General Merchandise | 4–7x | 52–91 days |
| Sporting Goods | 4–6x | 61–91 days |
| Furniture / Home Décor | 3–4x | 91–122 days |
| Auto Parts | 6–8x | 46–61 days |
Source: Onramp Funds, 2025; Netstock Industry Benchmarks, 2025
A Q4 2024 analysis of eCommerce retail data showed an industry average inventory turnover of 10.19 for that period — a reminder that seasonal surges in Q4 can temporarily elevate ratios well above annual averages for merchandise-heavy retailers.
A few patterns worth noting from these figures:
Perishable or trend-driven inventory turns faster. Grocery stores turn at 15–20x because product shelf life demands it. Fast fashion retailers push toward the top of the apparel range because seasonal demand is built into their model.
High-ticket, considered purchases turn more slowly. Furniture customers research before they buy. A 3.5x ratio in furniture is typically not a problem — it reflects normal purchase cadence, not a stocking issue.
Electronics has a tightening window. A 4–6x ratio in electronics suggests selling through stock in 61–91 days. Given how quickly technology products depreciate in perceived value, sitting on units for 120+ days usually means margin is being surrendered at markdown time.
For general retail stores with a mixed product assortment, the most useful reference point in recent data tends to suggest that a ratio of 4–6x represents a reasonable baseline, with higher being better as long as stockout rates stay in check. Understanding how to analyze retail store profitability in full requires pairing turnover benchmarks with margin data at the category level — neither metric tells the complete story on its own.
Why Does a Low Inventory Turnover Rate Hurt Your Cash Flow?
A low turnover ratio tends to create a cluster of compounding problems that often look unrelated until you trace them back to the same source.
Cash gets locked in slow-moving stock. Inventory purchased at cost represents cash that has already left the business. When stock doesn’t sell in a reasonable timeframe, that cash isn’t available for vendor payments, payroll, or restocking fast-moving items. This is one of the more common reasons a store with positive revenue can still face month-to-month cash pressure.
Storage costs accumulate quietly. Every square foot of shelf and stockroom space has a cost, whether that’s allocated rent, shelving, or the labor involved in receiving, counting, and maintaining stock. Dead stock occupies that space without generating any return. For a store paying $8,000 per month in rent, slow-moving inventory often suggests more of that footprint is being subsidized than it appears.
Markdown pressure compresses margins. Products that haven’t sold in 60–90 days typically require price reductions to move. A markdown of 20–30% on slow sellers is common practice, but it has a real effect on the gross margin for that category — and over time, over-purchasing followed by markdowns becomes a structural drag on profitability rather than an occasional exception. Stores that shift from reactive to planned markdowns in a 90-day window often see gross margin recover by 3–5 percentage points in that category.
Opportunity cost is real, even when it’s invisible. Fast-selling items that go out of stock while slow items occupy the budget and the shelf represent a measurable missed revenue opportunity. One retail operator dealing with a 2.8x turnover ratio found that roughly $40,000 in potential annual revenue from bestselling accessories was constrained by reorder delays — cash already committed to sitting stock. After correcting the imbalance, reorder fill rates for those categories improved from 61% to 94% within two quarters.
Revenue is what you sell. Cash is what you keep. Most store owners confuse the two — and inventory turnover ratio is one of the clearest signals of where that gap lives in the business.
Can a Turnover Rate Be Too High — and What Are the Risks?
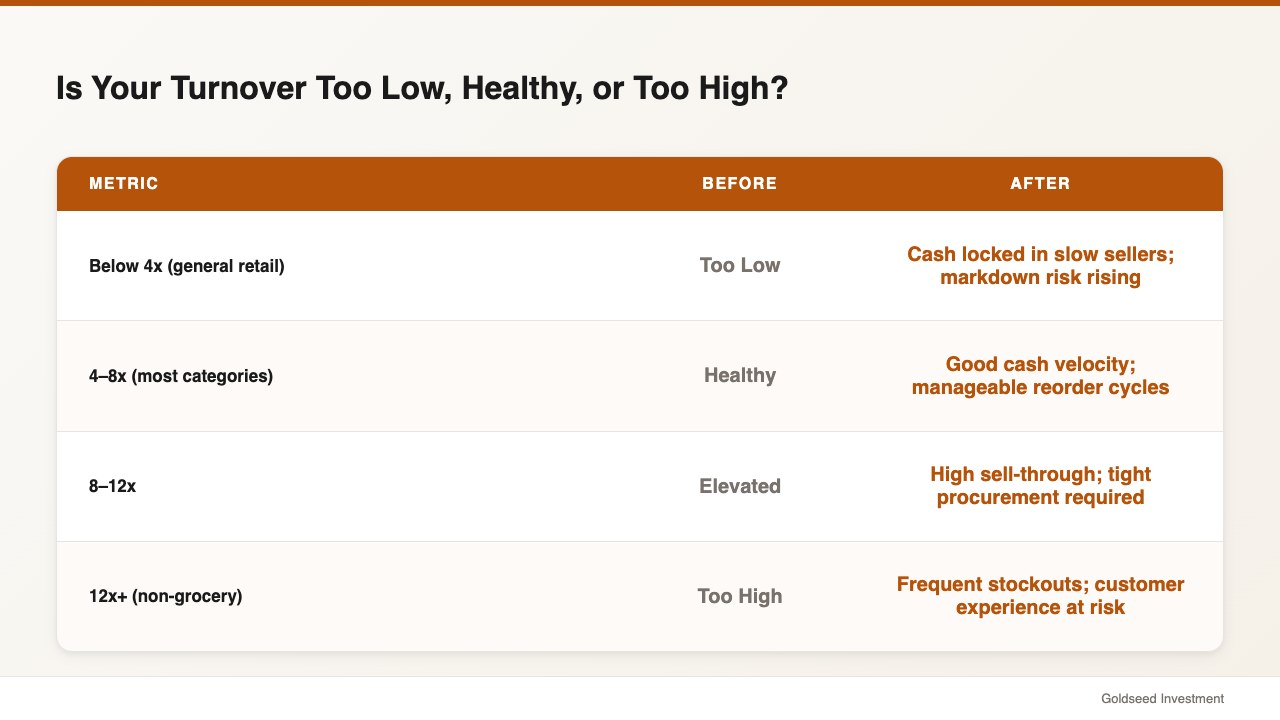
A high turnover ratio is generally positive, but past a certain point it can signal a different kind of problem: the store is running too lean, and stockouts are starting to cost money.
| Scenario | Turnover | What It Often Means |
|---|---|---|
| Too low (below category average) | < 4x for general retail | Cash locked in slow sellers; markdown risk |
| Healthy range | 4–8x for most categories | Good cash velocity; manageable reorder cycles |
| Elevated but fine | 8–12x | High sell-through; demands tight procurement |
| Potentially too high | 12x+ for non-grocery | Frequent stockouts; customer experience risk |
Source: Netstock, Onramp Funds 2025 benchmarks
When turnover climbs above the healthy range for a category, a few patterns tend to emerge:
Stockouts become frequent. If a store is selling through every 30 days, any disruption in the supply chain — a late shipment, a vendor minimum not met, a reorder placed three days late — can result in empty shelves. Each out-of-stock event in a category tends to suppress sales for that item for weeks, not just days, as customers who couldn’t find it develop the habit of looking elsewhere.
Reorder frequency increases costs. Placing more purchase orders means more shipping costs, more receiving time, and more opportunities for errors. At some point, running very lean on inventory in service of a high turnover ratio starts to cost more in operational friction than it saves in working capital.
The goal for most independent retail stores is a ratio that sits in the healthy range for the category — neither so low that cash is locked up in dead stock, nor so high that the shelves are regularly empty. Getting there requires accurate data, not just intuition.
How Can Retail Stores Improve Their Inventory Turnover in 2026?
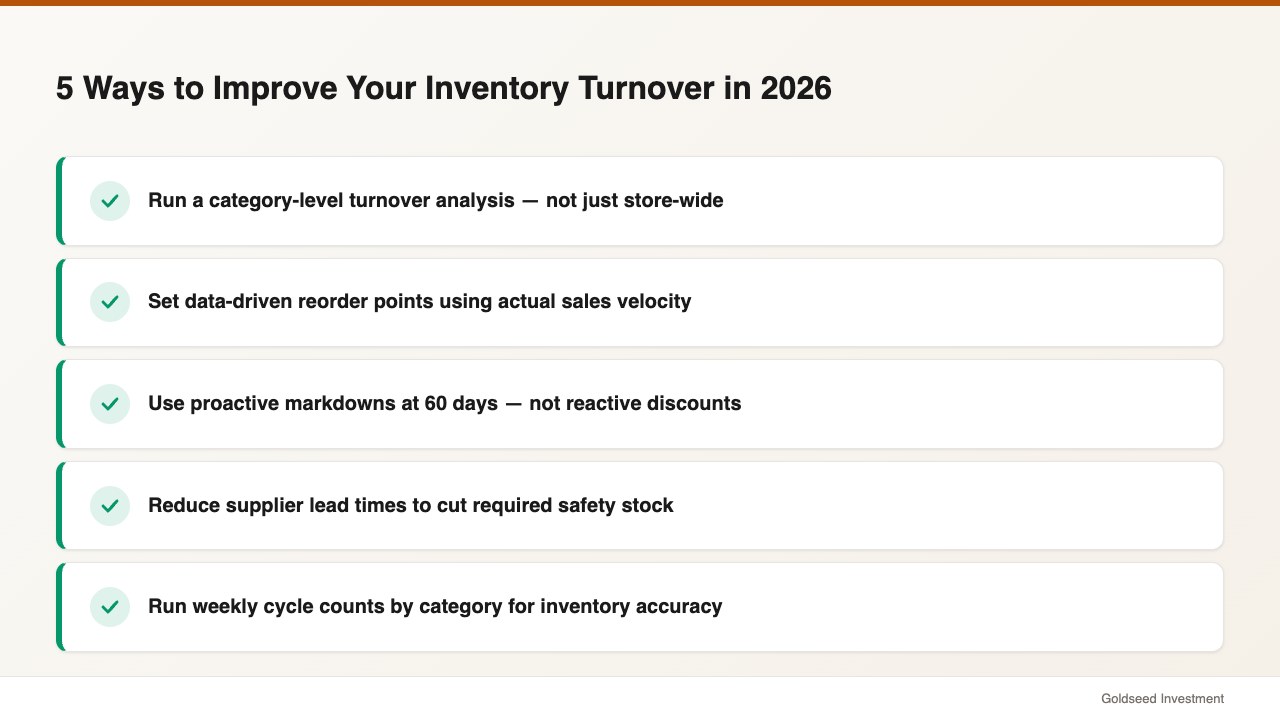
Moving a low turnover ratio upward is a process that in many cases takes one to two quarters to show measurable results. These five approaches represent the most reliable starting points for independent retailers.
1. Run a category-level turnover analysis first. Before changing purchasing habits, calculate turnover at the category level — not just store-wide. In most low-turnover situations, the problem is concentrated in two or three categories. Pull your COGS and average inventory for each category separately, calculate turnover, and compare against benchmarks. That analysis tells you where to focus rather than making blanket changes to purchasing across the board.
2. Set reorder points based on sales velocity, not gut feel. A reorder point is the inventory level at which a new purchase order triggers automatically. Setting these based on actual sales data — how many units sell per week, how long the supplier lead time tends to be — prevents both the over-purchasing that creates dead stock and the under-purchasing that creates stockouts. Calculate your reorder point as: (Average Daily Sales × Supplier Lead Time in Days) + Safety Stock.
3. Use markdowns proactively, not reactively. Most stores wait until dead stock is a significant problem before discounting. A more effective approach treats markdowns as a planned tool: if an item hasn’t hit a defined sell-through threshold at 60 days, a 15% markdown goes on automatically. This moves stock while value is still perceived as normal, rather than waiting until the item needs a 40% reduction to move at all.
4. Reduce supplier lead times where possible. Long supplier lead times often force stores to carry more safety stock than turnover ratios would otherwise require. A supplier with a 30-day lead time may require carrying twice the inventory of a supplier with a 14-day lead time for the same product. Reviewing supplier relationships with lead time as a factor — not just price and minimums — tends to open up working capital that was previously absorbed by safety stock requirements.
5. Run regular cycle counts by category. Physical inventory accuracy is a prerequisite for reliable turnover calculations. When inventory records don’t match what’s actually on the shelf — due to theft, receiving errors, or input mistakes — reorder calculations become unreliable and both overstocking and stockouts increase. Weekly cycle counts for high-velocity categories tend to catch discrepancies before they compound. For more on tracking your stock accurately, see retail inventory tracking systems.
Together, these approaches address the three most common root causes of low turnover: buying too much of the wrong things, not buying enough of the right things quickly enough, and not knowing which problem you have because the data isn’t clean.
FAQ
Q: What is a good inventory turnover ratio for a small retail store? A: For most general merchandise or specialty retail stores, a ratio between 4x and 6x per year tends to fall in a healthy range. Grocery and convenience stores typically run 15–20x due to perishability, while furniture stores often operate at 3–4x. The most useful comparison is against stores in the same category, not the overall retail average. A ratio meaningfully below your category benchmark usually suggests cash is being tied up in slow-moving stock.
Q: How often should I calculate my retail inventory turnover rate? A: Monthly calculations give the most actionable signal, especially if you carry seasonal categories where turnover shifts throughout the year. An annual calculation shows the overall picture but won’t catch in-season problems early enough to correct them. Many store owners calculate turnover by category on a monthly basis and track the trend over rolling 90-day periods to spot deteriorating categories before they become a cash problem.
Q: What is the difference between inventory turnover rate and sell-through rate? A: Inventory turnover rate measures how many full cycles of your stock you complete per year, based on COGS. Sell-through rate measures what percentage of units received in a specific period actually sold — typically calculated as (Units Sold ÷ Units Received) × 100. Sell-through tends to be more useful for category-level, time-bound analysis (e.g., “did we sell 70% of our spring apparel before summer?”), while turnover is more useful for ongoing cash flow and working capital analysis. Both measure velocity, but at different scales and with different decision applications.
Q: Can I use retail price instead of cost when calculating inventory turnover? A: Using retail price for both numerator and denominator produces a ratio, but it won’t match standard industry benchmarks, which are all COGS-based. Mixing retail price for inventory with COGS for the top line will significantly distort the ratio and make it impossible to compare against any published benchmarks. Stick with cost-based values for both inputs to get a meaningful, comparable number.