Small retail stores that keep total operating expense ratios below 35% of gross revenue tend to generate net margins of 5–12% — stores consistently exceeding 40% typically report near-zero profitability within three years.
Diane Torres opened her home goods boutique in Phoenix with a carefully planned budget. She had accounted for rent, inventory, and two part-time employees. What she hadn’t planned for: credit card processing fees that ran nearly $900 per month, an insurance renewal that came in $450 higher than the initial quote, and a POS subscription that auto-upgraded to a higher tier during year two. By month four, her actual retail store operating costs were running $5,700 above what she had originally projected.
This isn’t rare. Retail cost structures tend to be more layered than they first appear, and the line between covering bills and building a sustainable business often comes down to the categories most owners never track closely until something breaks.
This guide breaks down every meaningful cost category for small and mid-size retail stores in 2026 — with benchmarks by store type, real numbers, and the line items that often go unnoticed until they add up.
What Are the Main Monthly Costs of Running a Retail Store?
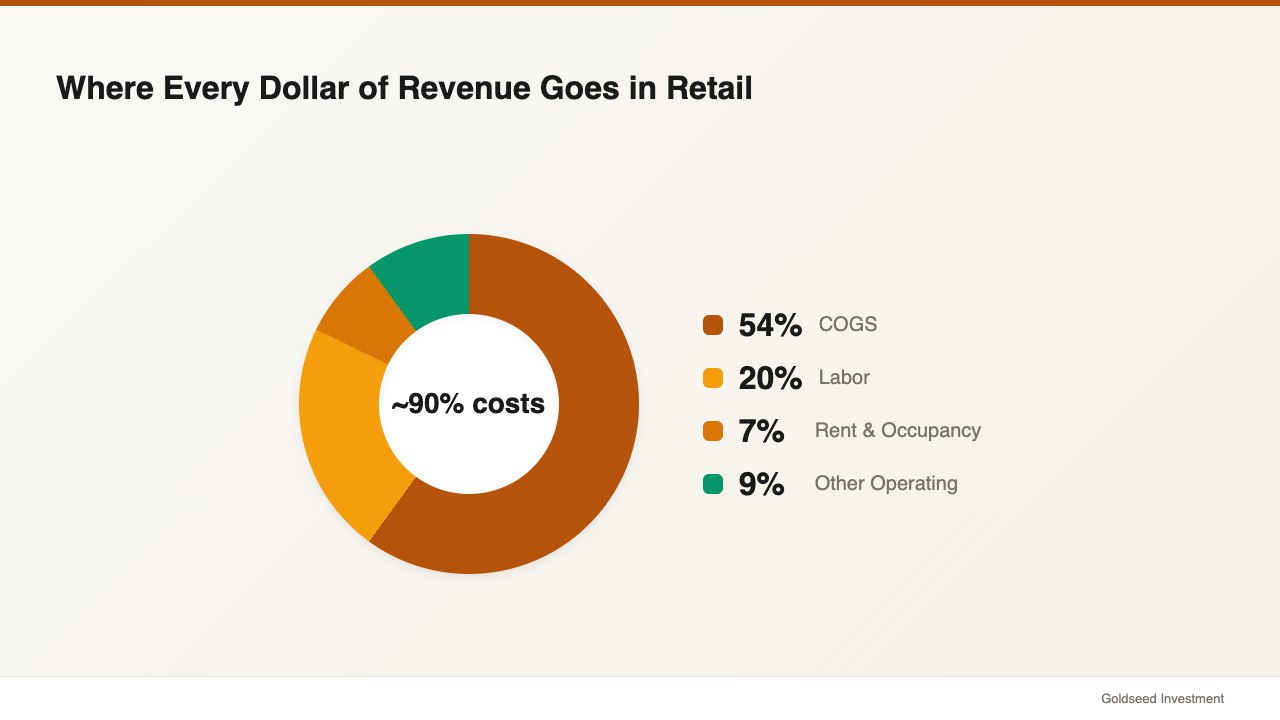
Retail store operating costs fall into six primary categories: rent and occupancy, labor, cost of goods sold (COGS), utilities and facility expenses, marketing, and miscellaneous overhead. Each behaves differently under pressure. Some are fixed — rent doesn’t change if you sell nothing on a Tuesday. Some are variable — COGS scales directly with sales volume. Some tend to creep up invisibly over time, which is where most surprises happen.
For a small-to-medium retail store generating $300,000–$600,000 in annual revenue, here’s how these costs typically distribute:
| Cost Category | % of Revenue (Typical Range) |
|---|---|
| Cost of Goods Sold (COGS) | 45–68% |
| Labor (wages + taxes + benefits) | 15–25% |
| Rent & Occupancy | 5–12% |
| Utilities & Facility | 1–3% |
| Marketing & Advertising | 1–4% |
| Miscellaneous Overhead | 3–8% |
Source: SCORE Small Business Financial Benchmarks, 2025
The COGS figure dominates because it represents money spent to acquire what was sold — it’s not an “operating cost” in the traditional sense. Your true operating expense ratio typically refers to all costs excluding COGS. Well-run independent retail stores tend to keep that ratio between 25–38% of gross revenue. Exceeding 40% on a sustained basis often signals a cost structure problem that revenue alone won’t solve.
How Much Does Retail Store Rent Cost Per Month?
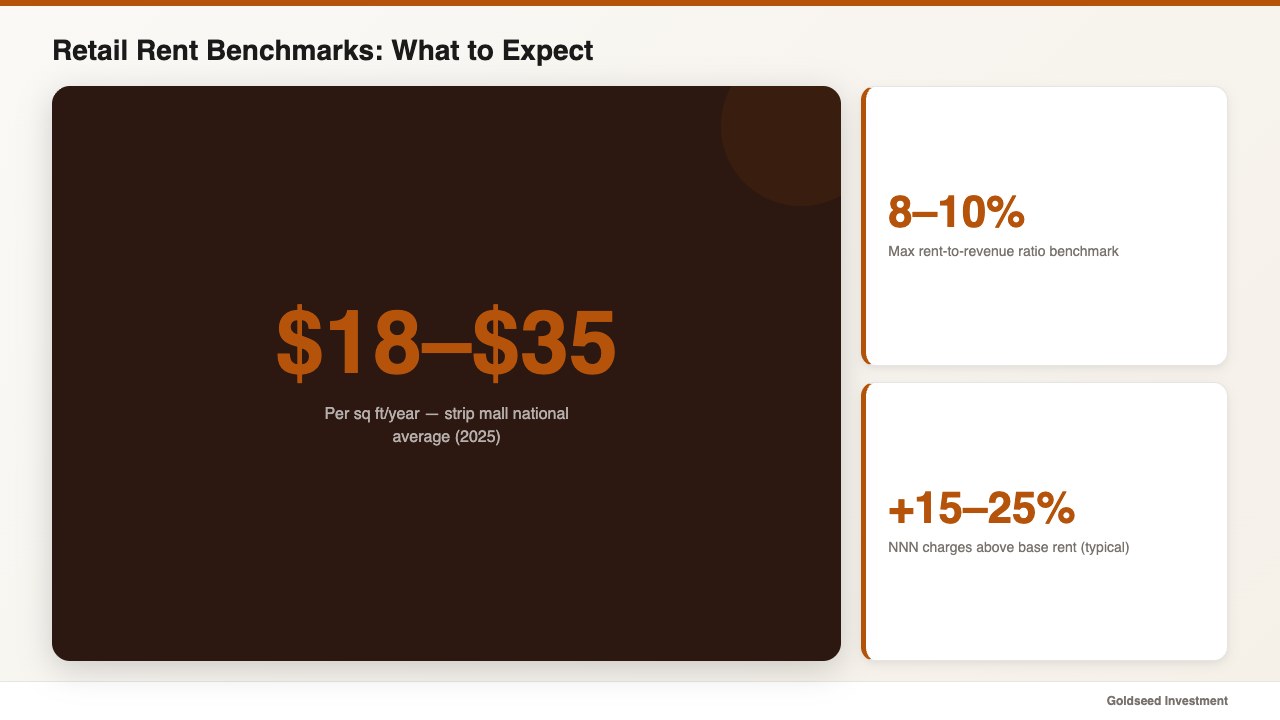
Rent is usually the largest single fixed line item, and it’s the one most difficult to renegotiate once signed. Nationally, retail strip mall space averaged $18–$35 per square foot annually in 2025, according to Cushman & Wakefield market data. Urban inline locations in major markets — Chicago, Los Angeles, Brooklyn — can run $50–$150 per square foot, sometimes higher in premium corridors.
For practical context: a 1,000-square-foot store in a suburban strip mall at $26/sq ft annually pays approximately $2,167/month in base rent. Add triple-net (NNN) expenses — property taxes, building insurance, and maintenance billed back to the tenant — and that figure often rises 15–25%.
A widely cited benchmark in retail planning: rent should stay at or below 8–10% of your gross revenue. A store generating $400,000 per year ($33,333/month) can realistically support a $2,500–$3,300/month rent burden without serious margin strain. Push past 12% and cash flow pressure tends to build gradually, then suddenly.
“One thing most people signing their first lease don’t realize,” one multi-location retail operator noted, “is that base rent is just the starting number. The NNN charges are what catch you off guard in year two when the landlord reassesses property taxes.”
Calculate your rent-to-revenue ratio every six months — not just at lease signing. Revenue can change, and so can NNN pass-throughs.
What Do Labor Costs Typically Look Like for a Small Retail Store?
Labor is both the most variable of the major cost categories and the hardest to cut without affecting service quality. According to the U.S. Bureau of Labor Statistics, the median hourly wage for retail sales workers was $16.57 in 2024. That number tends to run higher in states with elevated minimum wage floors, and higher still for experienced stock managers or shift leads.
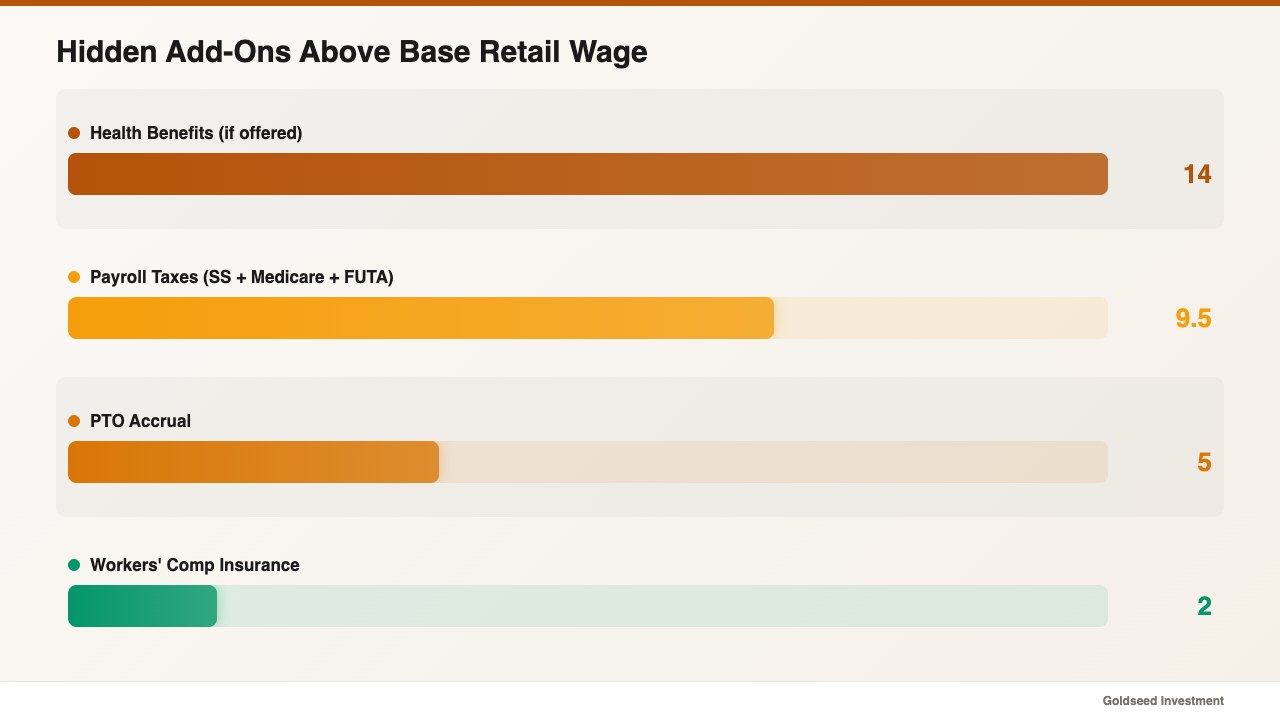
But the $16.57 figure captures only base wages. The true cost of an hourly retail employee typically runs 25–35% above their wage when you factor in:
- Employer payroll taxes (Social Security, Medicare, FUTA/SUTA): roughly 7.65–10% of wages
- Workers’ compensation insurance: varies by state, commonly 1–3% of payroll
- Paid time off accrual: depends on state requirements and store policy
- Health benefits if offered: typically $400–$900/month per employee in employer contribution
A retail employee at $18/hour working 32 hours/week costs approximately $576 in gross wages per week. Add the 30% overhead estimate and the true weekly cost approaches $749 — roughly $3,250/month for a single part-time worker.
For a small store with three full-time-equivalent staff and two part-timers, monthly labor all-in commonly falls in the $11,000–$18,000 range depending on wage rates and benefits structure. For detailed breakdowns of the benefits component specifically, see our retail employee benefits cost guide.
Pull your last 90 days of payroll data and calculate your actual labor-to-revenue ratio. Most owners find it runs 2–4 percentage points higher than their initial estimate once taxes and benefits are properly included.
How Does Inventory Cost Factor Into Monthly Operating Expenses?
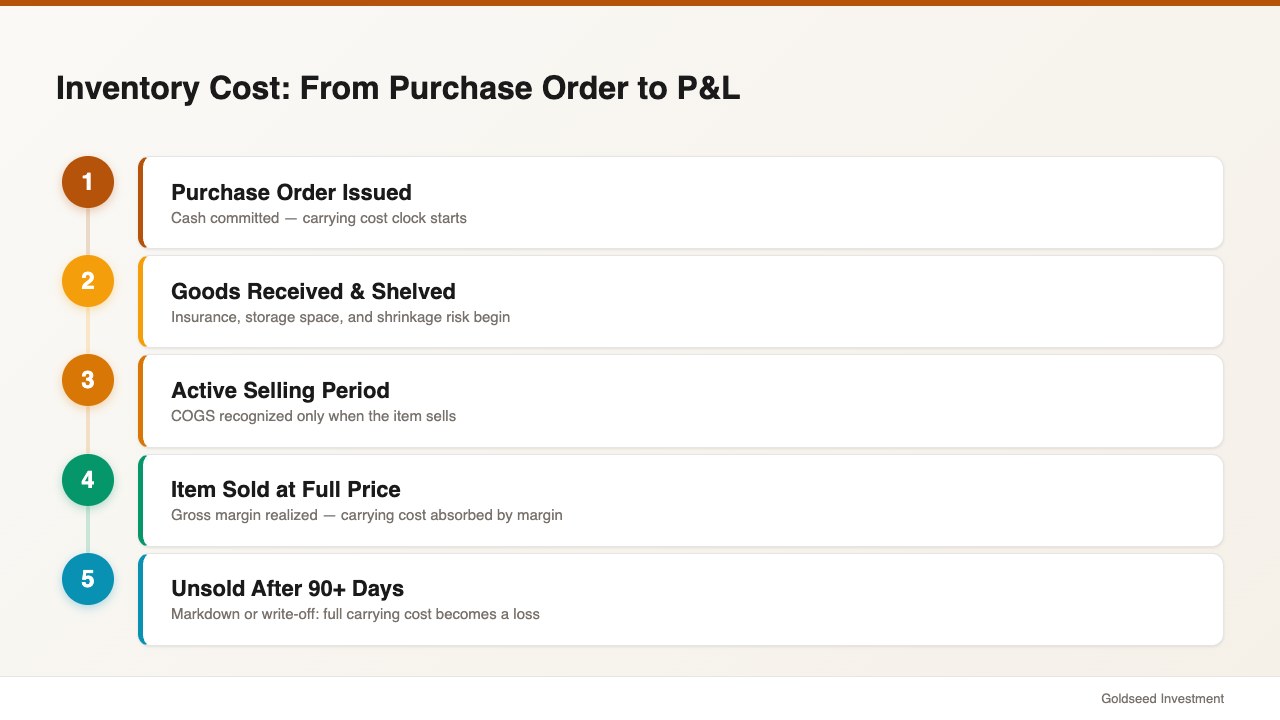
COGS and inventory carrying costs are often treated as synonymous. They are not. COGS represents what you paid for what you actually sold in a given period. Inventory carrying costs are what you pay to hold stock that hasn’t sold yet — and they tend to be invisible on a monthly P&L.
Standard supply chain research estimates inventory carrying costs at 20–30% of the inventory value held, per year. For a store maintaining $75,000 in average inventory, that’s $15,000–$22,500 per year — or $1,250–$1,875 per month — in costs that include:
- Storage and shelving space allocation (an opportunity cost of your physical footprint)
- Inventory insurance premiums
- Shrinkage: the National Retail Federation reports retail shrinkage averaged 1.44% of total retail sales in 2025, covering theft, administrative errors, and vendor fraud
- Markdown risk on slow-moving SKUs
- Capital cost: money locked in unsold inventory that could otherwise be deployed elsewhere
“The data was always there,” one multi-location retail operator described. “The problem was nobody had time to clean it. By the time anyone figured out a product wasn’t selling, the cash had already been sitting there for months.”
This is precisely why inventory turnover rate functions as a leading financial signal — not just a merchandise metric. For benchmarks by retail category, see our guide on retail inventory turnover rates.
Use your POS or inventory management system to calculate average days on hand for each product category. Anything sitting past 90 days in fashion, home goods, or specialty retail is in many cases generating negative returns when carrying cost is factored in.
Which Hidden Costs Do Most Retail Store Owners Underestimate?
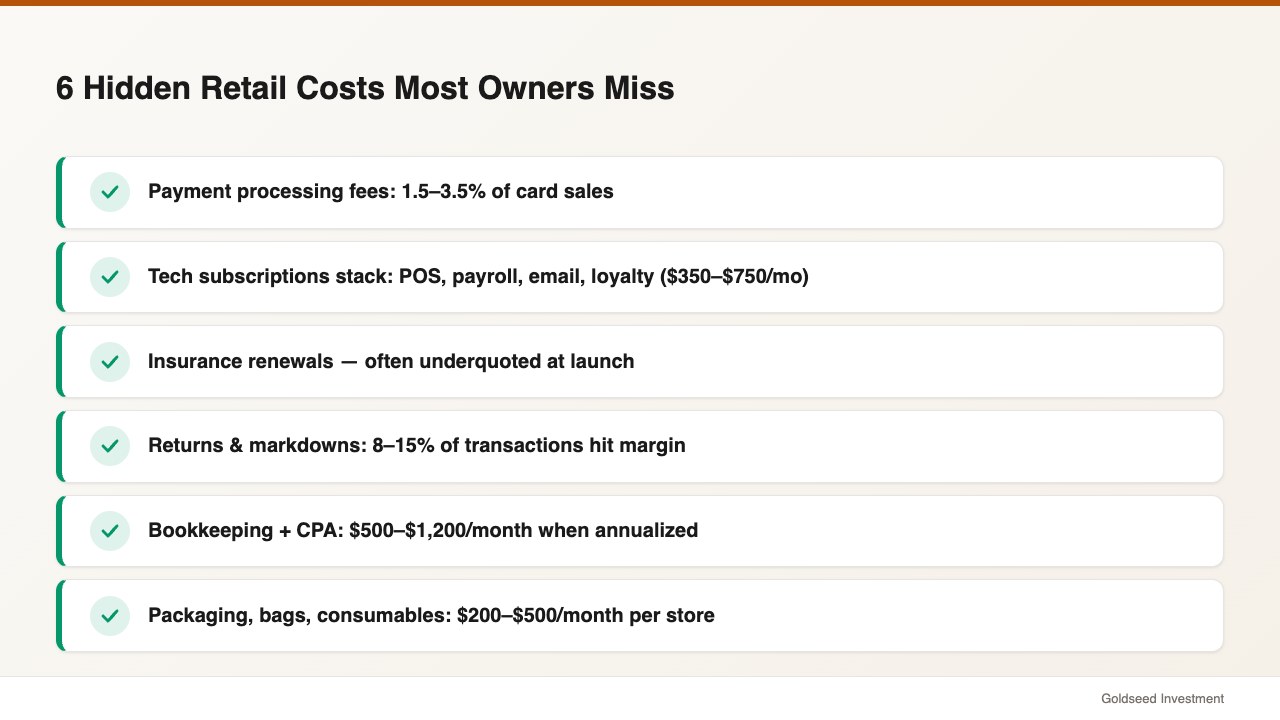
Ask most store owners to list their monthly expenses and they name rent, payroll, and stock. The categories that tend to get missed are smaller recurring charges that stack up to thousands per month without ever appearing as a single obvious line item.
Payment processing fees: Credit and debit card transaction fees run 1.5–3.5% of transaction volume depending on card mix and processor. A store doing $50,000/month in card sales at a blended rate of 2.2% is paying $1,100/month — $13,200 per year — in processing costs that often disappear quietly from settlement deposits rather than showing as a clear expense.
Technology subscriptions: POS systems, accounting software, email marketing platforms, loyalty apps, payroll tools, and scheduling software in combination commonly total $350–$750/month for a single-location operation. Many of these auto-renew annually at higher rates.
Insurance: Commercial general liability, property insurance, and business interruption coverage combined typically run $200–$600/month depending on store size, inventory value, and location. Many owners underestimate this at launch based on an initial quote that rises at renewal.
Returns and markdowns: Return rates in general merchandise retail in many cases run 8–15% of transactions. Markdowns to clear slow-moving inventory represent a direct margin hit that compounds if not managed proactively.
Accounting and bookkeeping: Outsourced bookkeeping for a small retail store typically costs $350–$650/month. Add a CPA for quarterly review and annual tax preparation and the average comes to $500–$1,200/month when annualized.
Bags, packaging, and consumables: Signage, bags, tissue paper, hangers, receipt paper, and cleaning supplies add up to $200–$500/month at most single-location stores — rarely tracked, almost never budgeted.
Diane’s situation — where actual costs ran nearly $5,700 above projection — in many cases traces directly to these categories stacking up unexamined.
How Do Monthly Operating Costs Compare Across Retail Store Types?
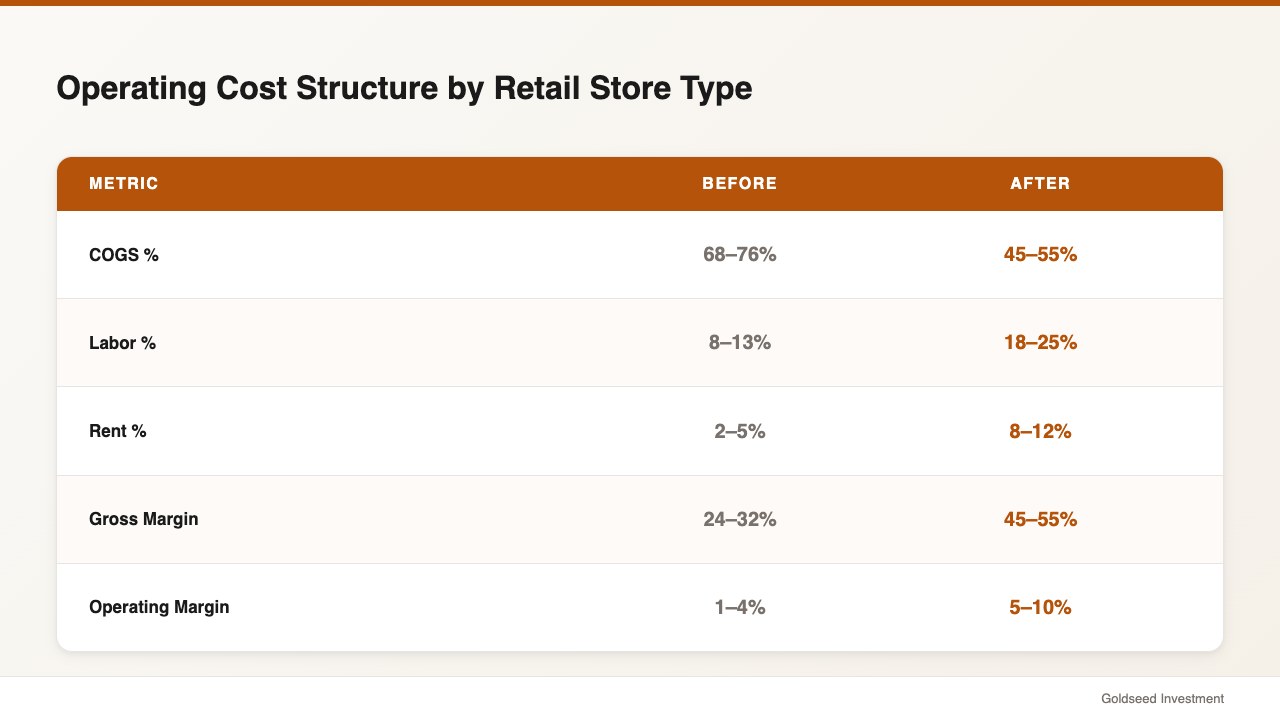
Operating cost structures don’t look the same across retail categories. A cost ratio that works for a grocery store would create serious problems for a fashion boutique, and vice versa. Here’s how the major categories typically compare:
| Store Type | COGS % | Labor % | Rent % | Operating Margin |
|---|---|---|---|---|
| Grocery / Convenience | 68–76% | 8–13% | 2–5% | 1–4% |
| Apparel / Fashion | 45–55% | 18–25% | 8–12% | 5–10% |
| Electronics | 60–70% | 10–15% | 4–7% | 2–6% |
| Home Goods / Specialty | 48–58% | 15–22% | 6–10% | 5–12% |
| Sporting Goods | 50–60% | 15–20% | 5–9% | 4–9% |
Source: SCORE 2025, IBISWorld U.S. Retail Trade benchmarks
Grocery and convenience stores survive on volume with lean labor ratios. Fashion retailers need higher gross margins to absorb higher labor and occupancy costs. Electronics runs thin margins on expensive product and requires high transaction volume to generate profit. For a granular look at the convenience store category specifically, our convenience store P&L guide breaks down this structure in detail.
Understanding where your store type fits in this table lets you benchmark realistically — and avoid the common mistake of comparing your specialty boutique’s expense ratios to a grocery chain’s.
What Is a Realistic Monthly Budget for a Small Retail Store in 2026?
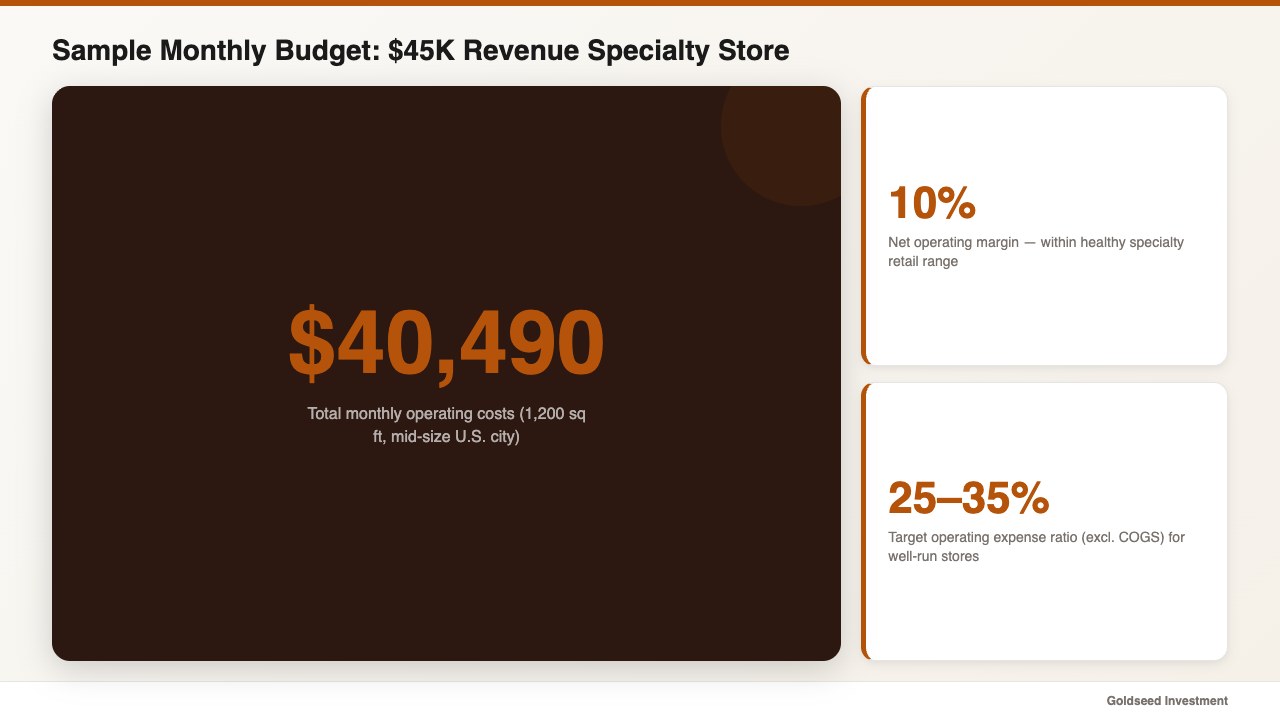
To make these numbers tangible, here is a sample monthly budget for a 1,200 square-foot specialty retail store in a mid-size U.S. city generating $45,000 per month in revenue:
| Expense Category | Monthly Amount |
|---|---|
| COGS (54% of revenue) | $24,300 |
| Labor — wages, taxes, benefits | $8,800 |
| Rent + NNN | $3,100 |
| Utilities (electricity, internet, water) | $580 |
| Payment processing (2.2% of sales) | $990 |
| Insurance | $380 |
| Technology (POS, accounting, scheduling) | $490 |
| Marketing (local + social) | $750 |
| Accounting / bookkeeping | $400 |
| Packaging, supplies, consumables | $300 |
| Miscellaneous buffer | $400 |
| Total Monthly Costs | $40,490 |
| Net Operating Surplus | $4,510 (10%) |
A 10% net operating margin is toward the middle of what’s considered healthy for specialty retail. Remove one underperforming staff line or negotiate rent down by $300/month and the margin improves by 0.7–1.5 percentage points.
Retailers with strong profit margins typically run operating expense ratios — everything except COGS — in the 25–35% range. If your non-COGS operating expenses consistently run above 40% of gross revenue, that suggests a cost audit is warranted before adding revenue is the priority.
According to SCORE, store owners who review their full operating cost breakdown on a monthly basis — not just at year-end — tend to catch expense creep early and respond before it compounds into a structural problem.
FAQ
Q: What is a good operating expense ratio for a retail store? A: Excluding COGS, a well-managed small retail store typically targets an operating expense ratio of 25–35% of gross revenue. Stores consistently above 40% tend to face margin compression that is difficult to recover from without either revenue growth or meaningful cost reduction. The appropriate target varies by category — grocery stores run higher COGS ratios but leaner operating overhead, while fashion stores carry more expense weight per dollar of sales.
Q: How much working capital does a small retail store need? A: Most small business advisors recommend 3–6 months of fixed operating expenses in accessible working capital. For a store with $14,000/month in fixed costs (rent, minimum staffing, technology, insurance), that suggests keeping $42,000–$84,000 available. Many stores operate with less than this in practice, which in many cases creates cash flow strain during seasonal slow periods or when unexpected costs arrive together.
Q: What percentage of retail revenue should go to rent? A: The standard benchmark is 5–8% of gross revenue for total occupancy costs including NNN charges. Exceeding 10% is generally considered a risk factor, particularly for stores with lower gross margins. Urban premium locations require correspondingly higher revenue and margins to justify the lease terms. If rent currently runs above 10% of your revenue, model whether a renegotiation or relocation would materially change your profitability.
Q: Are retail operating costs tax-deductible? A: Most ordinary and necessary business expenses for a retail store are deductible — including rent, employee wages (excluding certain owner compensation structures), utilities, technology subscriptions, insurance, marketing spend, and professional services fees. COGS is deducted separately via cost of goods sold on your income statement. Depreciation schedules apply to capital equipment. A qualified CPA familiar with retail operations will ensure proper categorization for your specific business structure.