Retail stores that monitor their cash flow statement monthly are 60% less likely to face a cash crisis — yet most small store owners never look past their profit and loss report.
A retail store cash flow statement explained simply: it is the financial document that shows how real money moved through your business — not just the profit your accounting software reports. Sarah Dominguez ran a home goods shop in Phoenix for three years. Her profit and loss report showed positive numbers every single month. Then her lease renewal came due and the landlord required two months upfront. The cash wasn’t there. Not because her store was failing, but because she had never looked at her cash flow statement. She didn’t know the difference between profit and cash. Many retail store owners are in exactly the same position.
This guide covers everything you need: what a retail store cash flow statement is, how the three sections work, how to read it, and how to build a simple version yourself each month.
What Is a Cash Flow Statement for a Retail Store?
A cash flow statement tracks the actual movement of money into and out of your business during a set period — typically a month, quarter, or year. Unlike an income statement, which records revenue when a sale is made (accrual accounting), the cash flow statement only counts money when it physically moves.
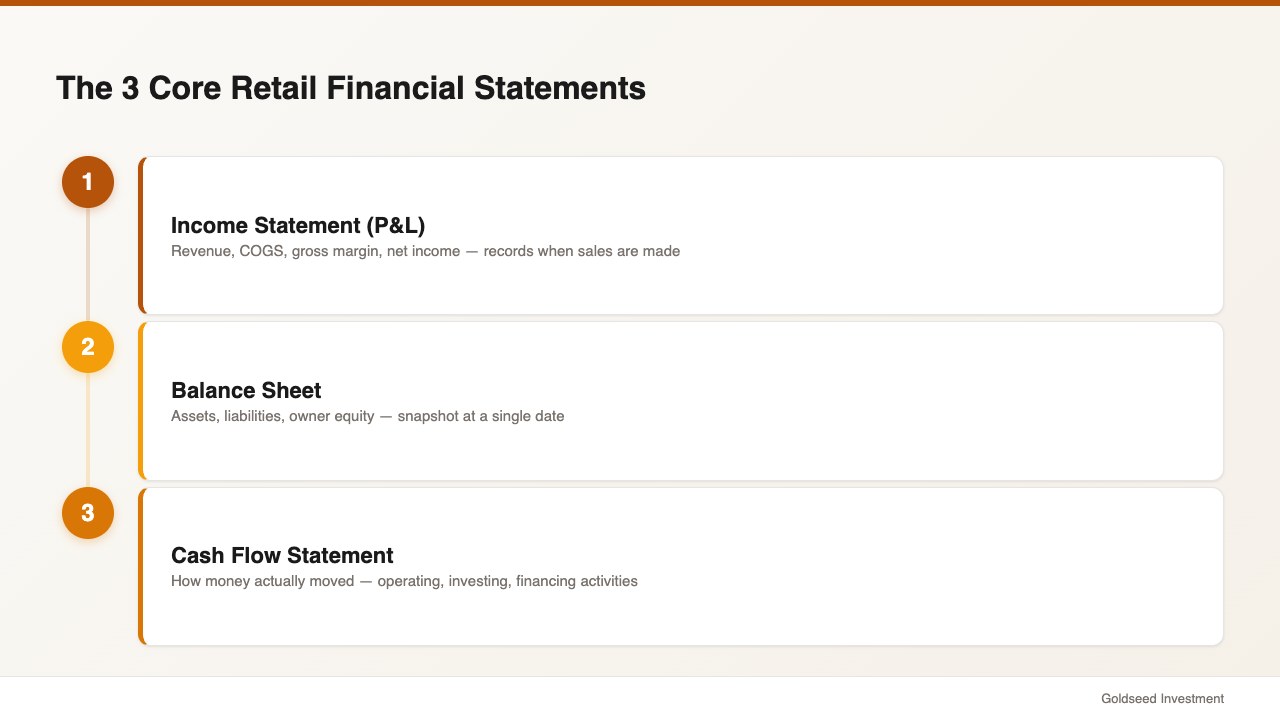
This document is one of three core retail store financial statements, alongside the income statement and the balance sheet. Together they tell the full story of your store’s financial health:
| Statement | What It Shows | Time Period |
|---|---|---|
| Income Statement (P&L) | Revenue, COGS, gross margin, net income | Month or year |
| Balance Sheet | Assets, liabilities, owner equity | Single date |
| Cash Flow Statement | How money actually moved | Month or year |
Source: GAAP Financial Reporting Standards, 2025
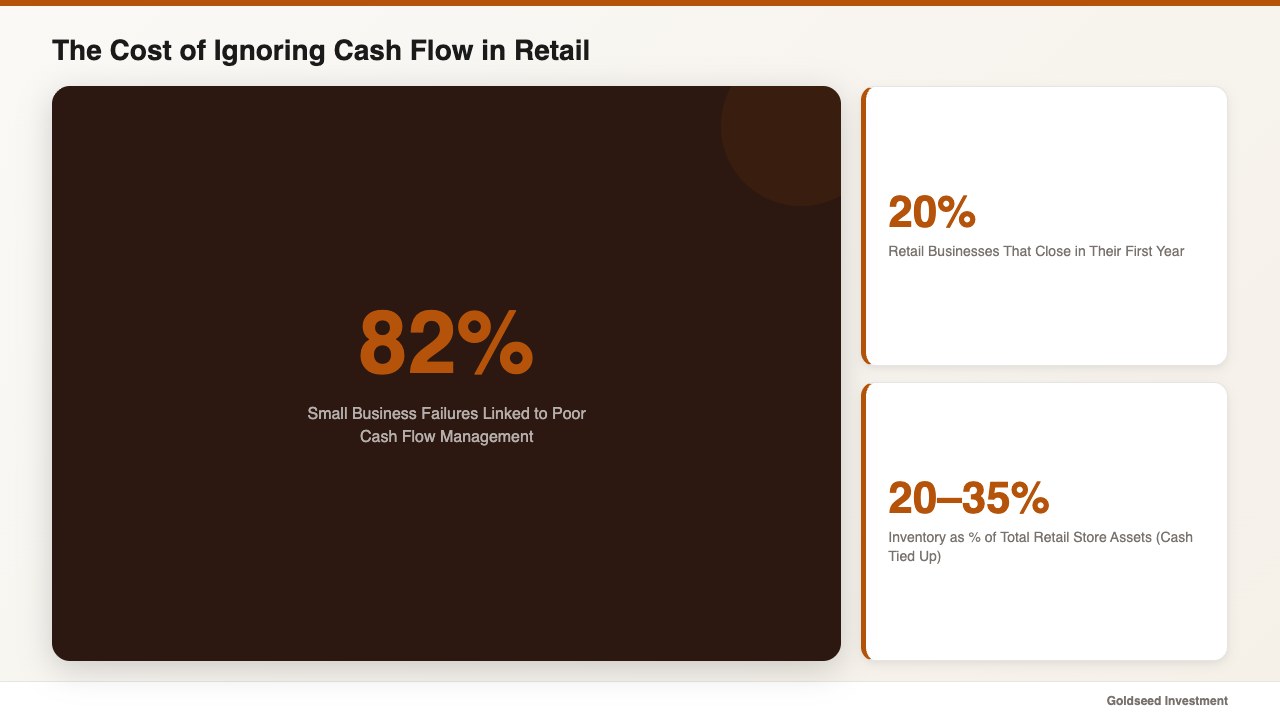
According to SCORE and U.S. Bank research, roughly 82% of small business failures are linked to poor cash flow management — not poor profitability. Stores don’t usually fail because they stop making sales. They fail because they run out of cash at the wrong moment.
The cash flow statement is the tool that shows you where that moment is coming.
How Does a Retail Cash Flow Statement Differ from a P&L?
Your profit and loss statement uses accrual accounting. It records income when you make a sale and expenses when they are incurred — regardless of when cash changes hands. The result: your P&L can show profit while your bank account is running dry.
Here is where the gap tends to appear in retail:
Inventory purchases. You buy $20,000 of merchandise ahead of the holiday season. That cash leaves your account immediately. On your P&L, you don’t see that cost hit until the items are sold and recorded as cost of goods sold (COGS). Your cash flow statement shows the outflow now.
Depreciation. Your P&L includes a monthly depreciation charge on your fixtures and equipment — an expense that reduces reported profit but involves no actual cash payment. Your cash flow statement adds depreciation back because no money left the account.
Supplier payment timing. You purchase $8,000 in goods on net-30 terms. Your P&L records the accounts payable expense immediately. But the cash outflow doesn’t hit your statement until the check clears 30 days later.
The retail cash flow management gap between reported profit and available cash often widens during growth phases. A store increasing inventory to meet higher demand can show improving gross margin while its working capital is under significant strain.
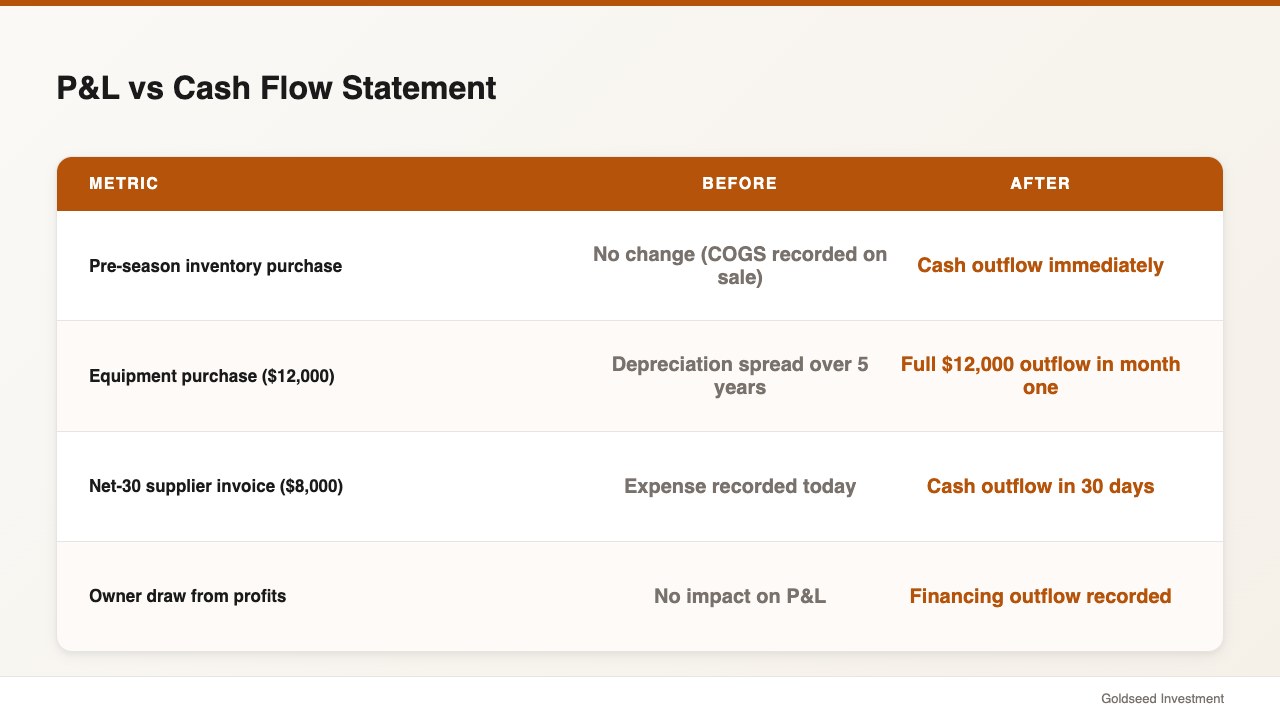
| Situation | P&L Shows | Cash Flow Statement Shows |
|---|---|---|
| Pre-season inventory purchase | No change yet (COGS on sale) | Cash outflow immediately |
| Equipment purchase | Depreciation spread over years | Full purchase cost now |
| Net-30 supplier invoice | Expense recorded today | Cash outflow in 30 days |
| Owner draw from profits | No change | Financing outflow |
Source: Investopedia, GAAP Accounting Standards, 2025
The Three Sections Every Retail Owner Must Understand
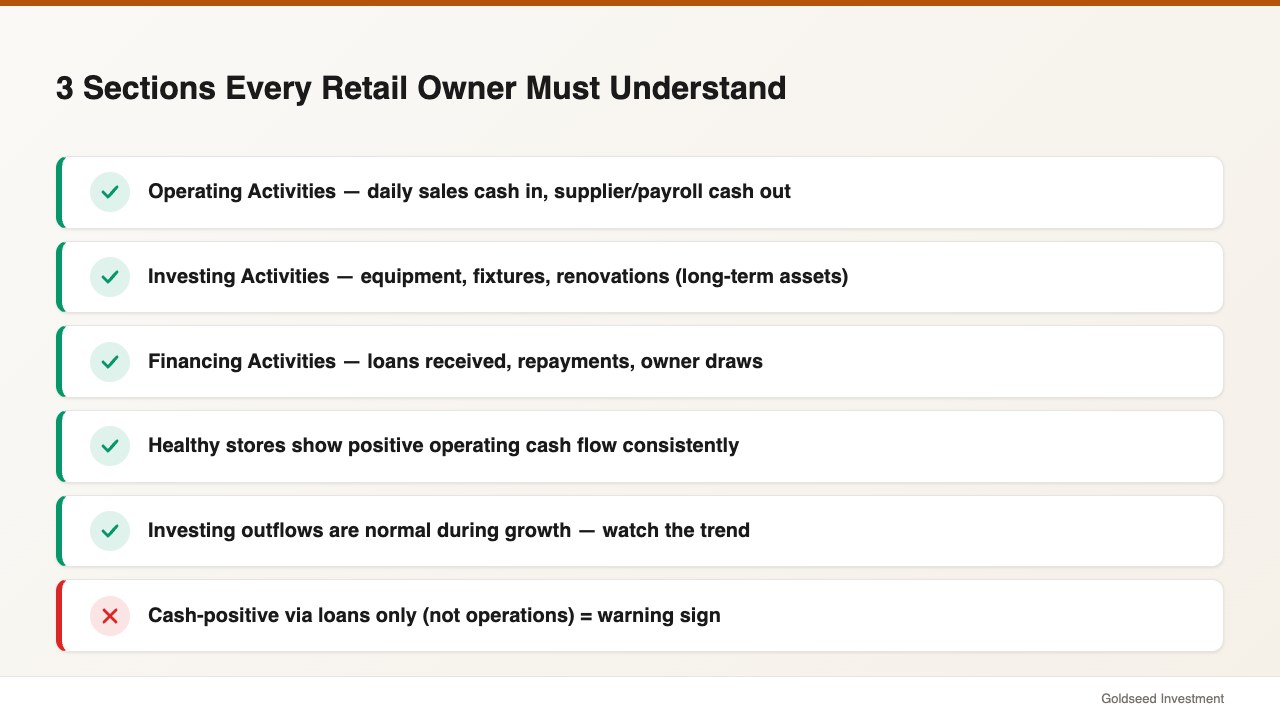
1. Operating Activities
This section covers cash generated from your store’s daily retail operations. It starts with net income and adjusts for non-cash items and changes in working capital.
Operating inflows: cash collected from customers, supplier refunds. Operating outflows: cash paid to suppliers for inventory, payroll, rent, utilities, insurance premiums.
Healthy retail stores generally show positive operating cash flow. If operating cash flow is consistently negative — meaning your core business consumes more cash than it generates — that pattern suggests a structural issue, not just a temporary squeeze.
2. Investing Activities
This section tracks cash tied to long-term assets. For a retail store, this in many cases includes point-of-sale hardware upgrades, refrigeration equipment, store renovations, or vehicle purchases.
Investing outflows are expected when a store is growing or updating its setup. The risk is funding ongoing capital expenditures out of operating cash, leaving insufficient reserves for daily expenses.
3. Financing Activities
Financing activities reflect how your business is funded. This includes loan proceeds received, loan repayments made, owner capital injections, and owner draws.
A store that looks cash-positive only because of recent loan proceeds — not because of operating performance — is worth watching. Loan repayments will eventually reduce cash flow whether or not operating performance improves.
How Do You Read a Retail Store Cash Flow Statement?
Reading a cash flow statement gets straightforward once you know what to look for. Here is a practical approach for store owners.
Start with operating cash flow. This is the number that matters most for ongoing retail operations. It shows whether the business of selling products is generating or consuming cash.
Operating Cash Flow = Net Income + Depreciation – Increase in Inventory – Increase in Accounts Receivable + Increase in Accounts Payable
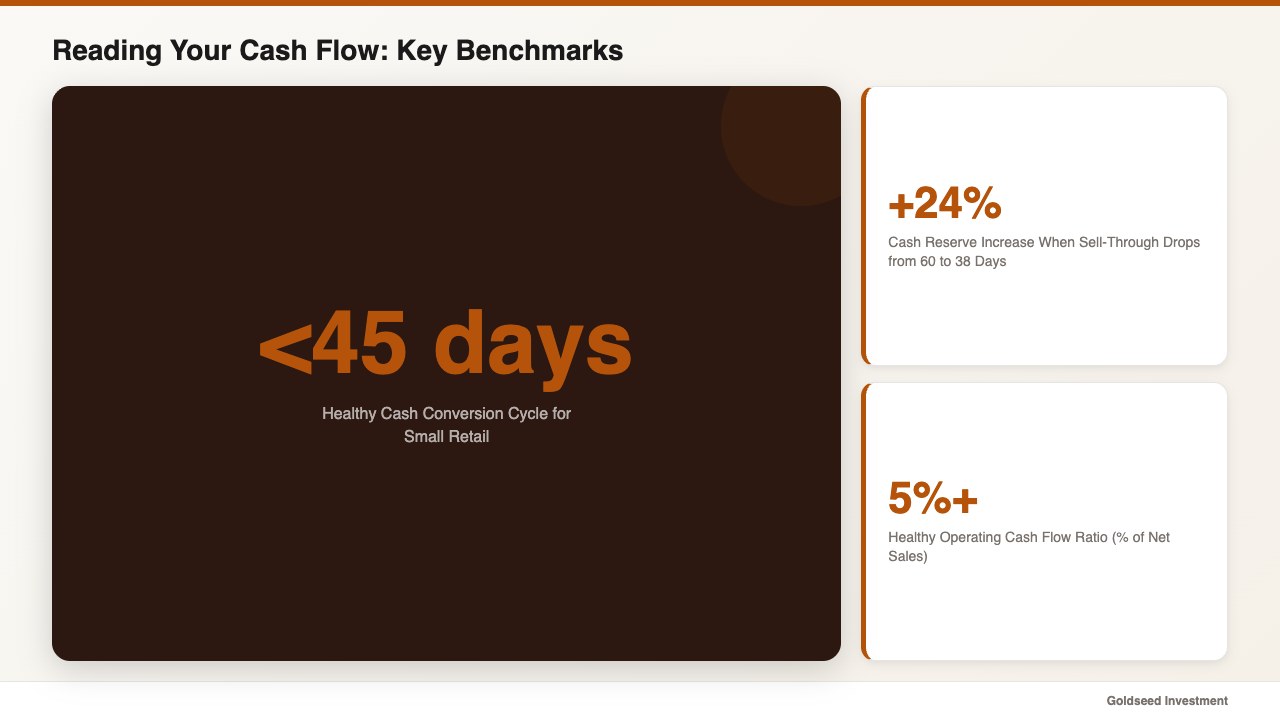
Check the cash conversion cycle. This metric tells you how long your inventory investment takes to turn into cash. The formula: Days Inventory Outstanding + Days Sales Outstanding – Days Payable Outstanding. For most small retail stores, a cycle under 45 days suggests cash is moving well. Store owners who reduced their sell-through timeline from 60 days to 38 days saw cash reserves increase by an average of 24% without any change in sales volume, according to National Retail Federation operations data.
Look at the trend, not just a single number. Negative operating cash flow in October (stocking up for the holidays) is expected. Negative operating cash flow in April, May, and June is a warning.
Review the ending balance. Ending cash = Beginning cash + Operating CF +/– Investing CF +/– Financing CF. This should match your bank statement. If it doesn’t, something is missing from your records.
Aim to know your operating cash flow every month. In many cases, cash problems become visible 60–90 days before they become crises — but only if you are tracking.
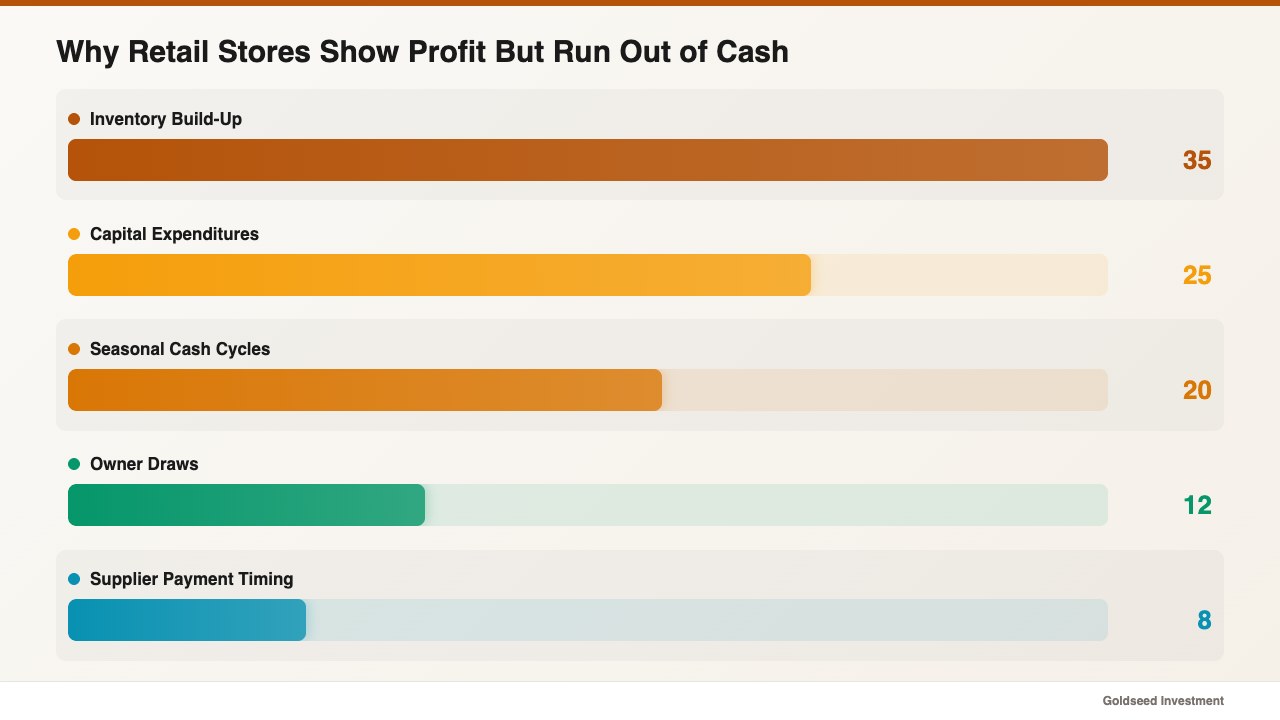
Why Does Your Store Show Profit But No Cash?
This is the most common and most costly financial puzzle in retail. One retail operator managing multiple locations described the experience directly:
“Revenue felt real. But the cash wasn’t there when we needed it. Turns out the money was tied up in inventory, lease deposits, and equipment we hadn’t depreciated properly. We didn’t know until we looked at the actual cash ledger.”
Several specific mechanisms drive the profit-cash gap.
Inventory build-up. According to NRF industry research, inventory represents 20–35% of total assets in most retail stores. Each dollar of unsold stock is cash that has left your bank account but hasn’t returned yet. A store that increases inventory from $45,000 to $62,000 over a quarter has deployed $17,000 in cash — cash that won’t come back until those items sell.
Seasonal cash cycles. Retail cash flow rarely follows a smooth pattern. A boutique clothing store in many cases collects most of its annual cash in November and December but pays suppliers in September and October. The P&L smooths this timing; the cash flow statement shows the seasonal reality in full.
Depreciation timing. Your P&L spreads a $12,000 equipment purchase across five years as a $200/month depreciation expense. Your cash flow statement shows the $12,000 leaving in month one. Stores that make multiple capital purchases in a single year often experience a significant cash gap that their profit figures completely hide.
Owner draws. Distributions taken from business profits appear as financing outflows. A store with $4,000 in monthly net income but $3,500 in owner draws may look profitable on the P&L while accumulating almost no cash reserves.
BLS small business survival data from 2024 indicates approximately 20% of retail businesses close within their first year — with cash flow gaps cited as a leading factor, often despite solid gross margin performance.
How to Build a Monthly Cash Flow Statement Without an Accountant
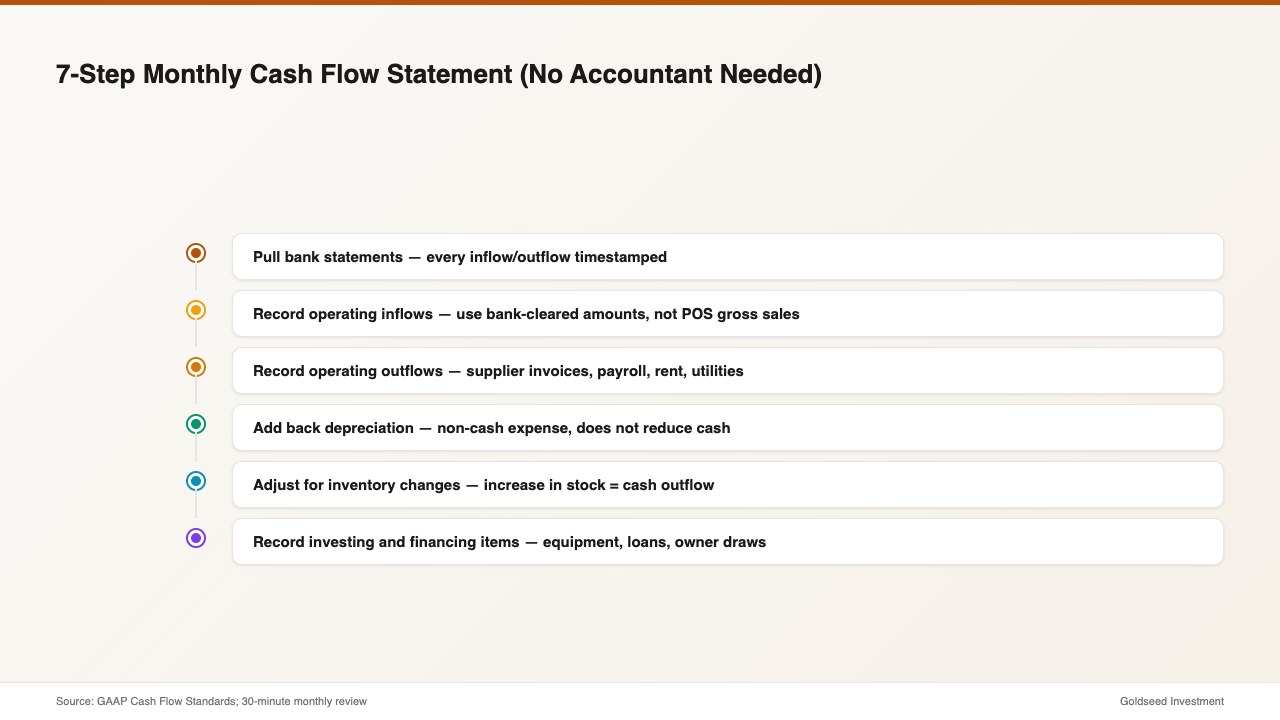
You do not need accounting software or a CPA to produce a working cash flow statement. A focused 30-minute review of your records each month covers most of what you need. For a deeper guide to building all three financial reports at once, see how to create financial statements for a retail store without an accountant.
Step 1: Pull your bank statements. Your actual cash movements are recorded there. Every inflow and outflow is timestamped and verifiable.
Step 2: Record operating inflows. Add up all cash received from customers during the period. Use bank-cleared amounts, not POS gross sales — the two can differ by days when credit card settlement is involved.
Step 3: Record operating outflows. Tally cash actually paid out: supplier invoices, payroll, rent, utilities, credit card processor fees, insurance. Use payment date, not invoice date.
Step 4: Add back depreciation. Ask your accountant or tax preparer for the monthly depreciation schedule on your assets. Add this amount back to net income in your operating section — it reduced reported profit but did not use cash.
Step 5: Adjust for inventory changes. If your inventory value increased by $6,000 this month, subtract $6,000 from operating cash flow — that cash is now sitting on your shelves. Stores that identified inventory overstock early through this step cut their cash conversion cycle from an average of 58 days to 31 days, according to operations data compiled by NYU Stern School of Business.
Step 6: Record investing and financing items. Note equipment purchased, loans received or repaid, and owner draws made during the month.
Step 7: Calculate ending cash. Starting cash + all inflows – all outflows = ending cash. Cross-check against your bank closing balance.
Review this monthly. The pattern across three months reveals your store’s cash rhythm — and gives you enough advance notice to adjust before problems arrive.
Common Cash Flow Mistakes Retail Owners Make
Treating profit as cash. The most frequent mistake. Net income is an accounting figure. Cash is what you spend. A store running on the P&L alone misses the inventory drain, the capital expenditure timing, and the financing flows that determine whether there is money in the account when it matters.
Skipping the shrinkage adjustment. Inventory shrinkage — theft, damage, or counting errors — reduces your inventory value without a corresponding cash inflow. Stores with shrinkage rates above 1.5% often find their working capital projections are off by meaningful amounts because the inventory line doesn’t reflect what’s actually available to sell.
Ignoring seasonal cash low points. Retail sell-through rates vary significantly by season. Most store owners know their busy season, but fewer map the cash valleys that follow — the periods when inventory is replenishing, supplier bills are coming in, and sales haven’t picked up yet. Mark these dates on your calendar and build a cash reserve target for each.
Commingling personal and business accounts. This makes it nearly impossible to read cash flow accurately. Every personal expense run through the business account distorts both the operating and financing sections. Keep them separate.
Skipping the investing activities section. A store spending $1,500–$2,500 per month on equipment maintenance and upgrades may look cash-positive in operations while slowly depleting reserves through investing outflows. Both sections matter.
FAQ
Q: How often should a retail store review its cash flow statement? A: Monthly is the standard for most small retail stores. During high-inventory seasons — typically late summer through fall — reviewing it weekly gives you better control over supplier payment timing and cash reserves.
Q: What’s a healthy operating cash flow ratio for a small retail store? A: Divide operating cash flow by net sales. A ratio above 5% is generally considered healthy for small retail operations. NYU Stern’s retail sector data from 2025 puts typical net margins at 2.5%–5.5% by category — meaning operating cash flow should at minimum match net income once depreciation is added back.
Q: Can I use my POS data to build a cash flow statement? A: Your POS is a good starting point for tracking sales volume, but it records transactions at the time of sale — not when cash clears your bank. For a cash-basis review, use your bank statement as the primary source and reconcile it against your POS gross sales each month. For a related look at P&L tracking in retail, see convenience store profit and loss guide.
Q: What is the difference between operating cash flow and free cash flow? A: Operating cash flow reflects cash from daily store operations. Free cash flow subtracts capital expenditures — equipment purchases, renovations, hardware upgrades — from operating cash flow. If your store generates $9,000 in operating cash flow but spends $2,500 on equipment, your free cash flow is $6,500. Free cash flow is the number most relevant to understanding how much cash the store actually has available.
Q: My store shows profit every month but I’m always short on cash — what should I do? A: Start by calculating your cash conversion cycle: how long does it take from buying inventory to collecting cash from customers? Then check your accounts payable timing — are you paying suppliers faster than you are collecting from sales? Finally, review your investing activities for any capital expenditures that may be consuming cash without appearing on the P&L as a current expense. In most cases, one of these three areas explains the gap.