Retail gross margin vs net margin explained in plain numbers: a store with a 32% gross margin can still end the year with a 2% net margin after rent, labor, and shrinkage.
Carla Mendes owns two convenience stores outside San Antonio. Her monthly sales report shows a gross margin of 32%, which on paper looks healthy for a c-store. But her bank balance tells a different story: after rent, payroll, utilities, insurance, and a stubborn shrinkage problem, her net margin last year dropped from 3.1% to 1.9%. That gap between the two numbers is where most retail owners lose the thread of their own profitability metrics.
This is the single most useful conversation a retailer can have with their own P&L. Retail gross margin vs net margin is not an accounting exercise. It is how you tell pricing problems apart from operating problems, and how you decide whether to renegotiate with a vendor or rethink your schedule.
What’s the Real Difference Between Gross Margin and Net Margin?
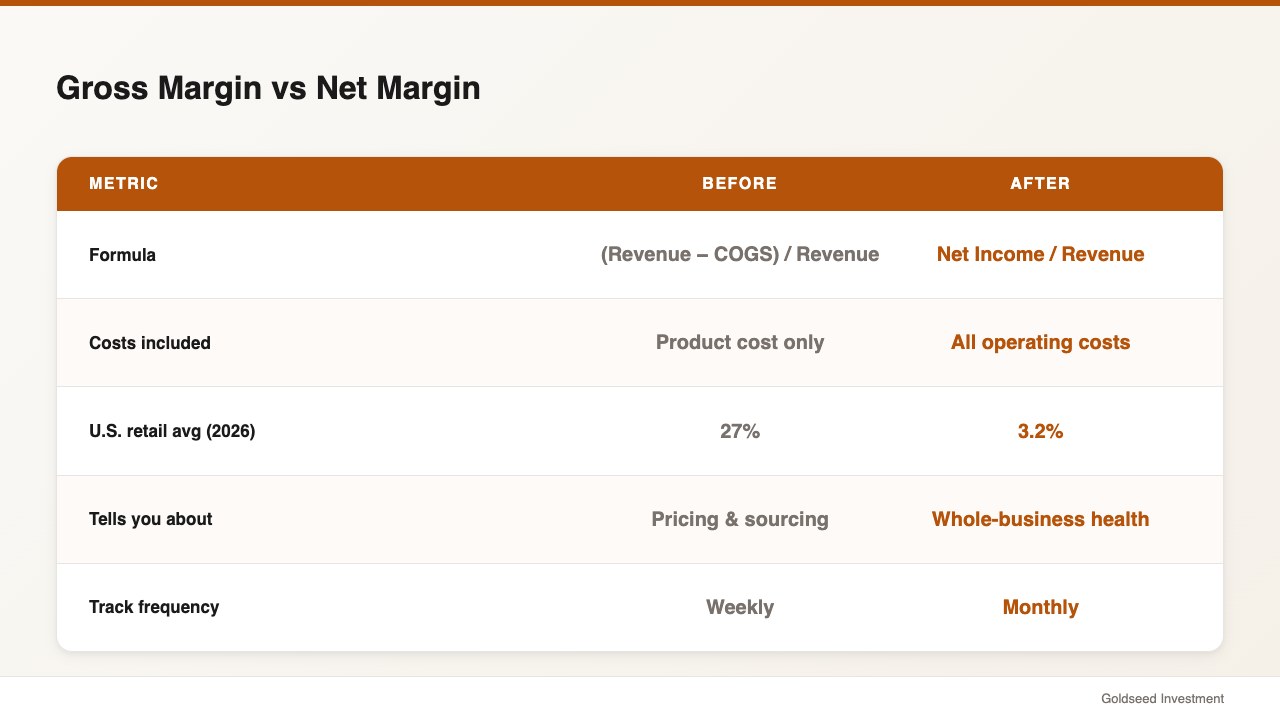
Gross profit margin retail is what is left after you pay for the product itself. Net profit margin retail is what is left after you pay for everything else that keeps the doors open.
Gross margin only cares about two line items: revenue and cost of goods sold (COGS). If you sell a $3 bottle of soda that cost you $1.80, your gross margin on that unit is 40%. Roll that up across every SKU you sell in a month and you have your store’s gross margin.
Net margin, in contrast, is what remains after rent, labor, utilities, insurance, card processing fees, shrinkage, depreciation, taxes, and every other operating cost. It is the number that tells you whether the business itself is worth running.
The gap between them is where retailing lives or dies. A store can have a perfectly reasonable gross margin and still lose money because its operating expense ratio is too high. According to the NYU Stern Damodaran dataset (January 2026), general U.S. retailers averaged a 27% gross margin and a 3.2% net margin — meaning roughly 24 points of revenue evaporate between the two lines.
How Do You Calculate Each One in a Real Retail Store?
The retail margin formula is simple, but the inputs tend to hide a lot of assumptions. If you have ever wondered how to calculate gross margin and net margin side by side, the two formulas are:
Gross margin = (Revenue − COGS) ÷ Revenue
Net margin = Net Income ÷ Revenue
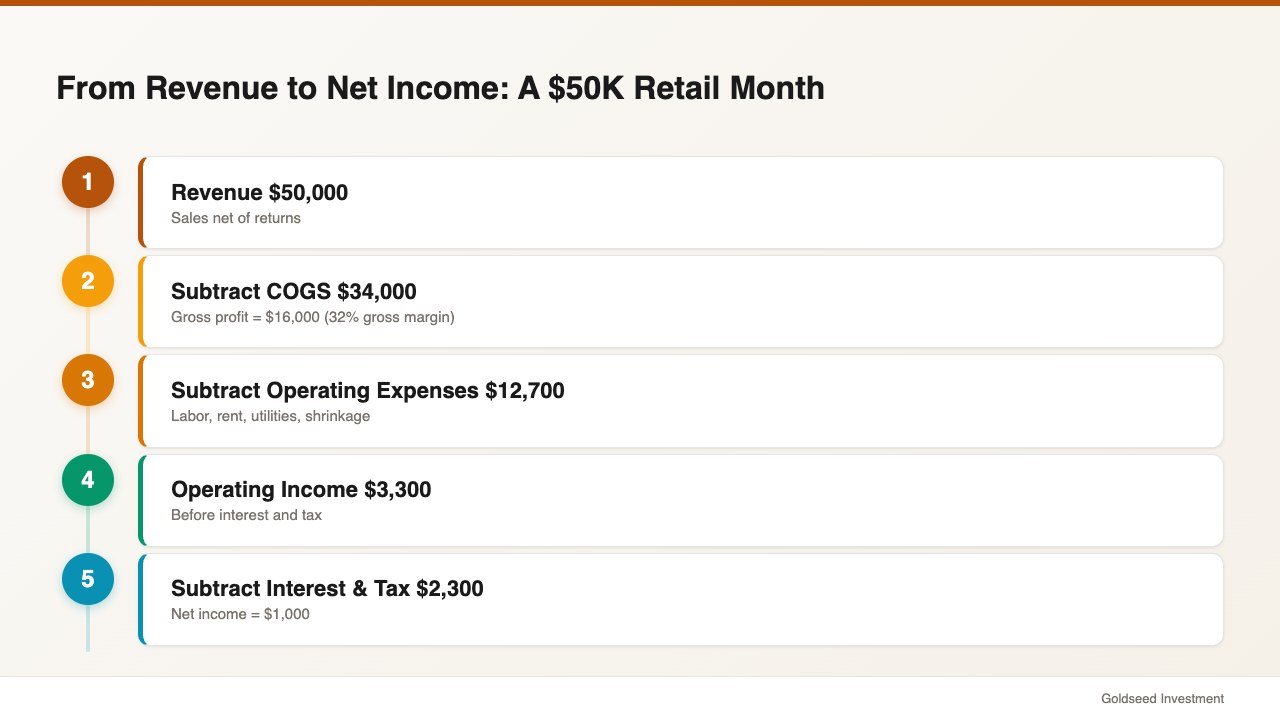
Here is how it plays out in one of Carla’s stores, using a clean $50,000 revenue month:
| Line item | Amount | Notes |
|---|---|---|
| Revenue | $50,000 | Sales net of returns |
| COGS | $34,000 | Beginning inventory + purchases − ending inventory, per IRS Publication 334 |
| Gross profit | $16,000 | |
| Gross margin | 32% | ($16,000 ÷ $50,000) |
| Labor | $6,400 | Includes owner draw |
| Rent | $3,200 | |
| Utilities & cards | $1,500 | |
| Insurance & licenses | $700 | |
| Shrinkage adjustment | $900 | 1.8% of sales |
| Operating expenses total | $12,700 | |
| Operating income | $3,300 | |
| Interest & tax | $2,300 | |
| Net income | $1,000 | |
| Net margin | 2% | ($1,000 ÷ $50,000) |
Source: Operator case file, two-store Texas c-store group, 2026. COGS method per IRS Publication 334.
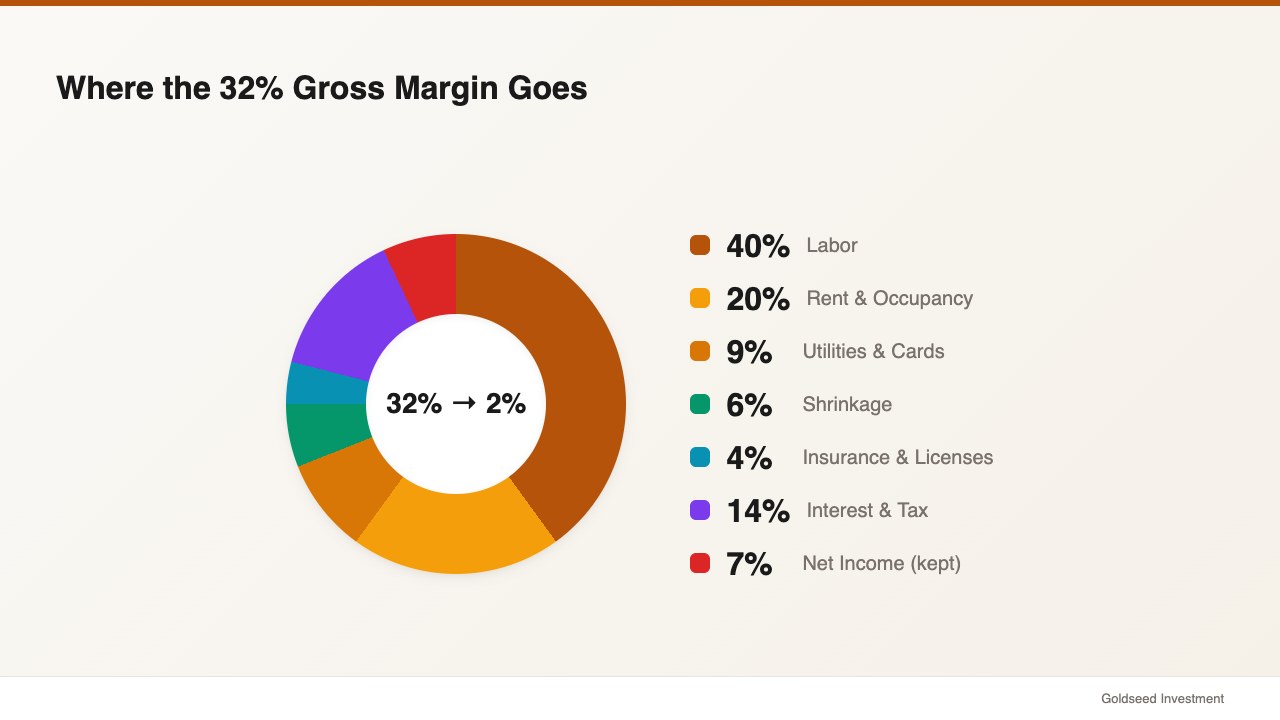
That is what it looks like when a 32% gross margin collapses into a 2% net margin. Nothing is mathematically wrong. The pricing is fine. The shrinkage is a little above the NRF average of 1.6% but not catastrophic. The problem is structural: c-store operating expenses simply eat almost everything the gross margin creates.
Before writing a single check to fix anything, pull your last three months of P&Ls and run both calculations. If you are unsure how the retail P&L is structured, see our convenience store profit and loss walkthrough for a line-by-line example.
What Are Healthy Retail Gross Margin and Net Margin Benchmarks in 2026?
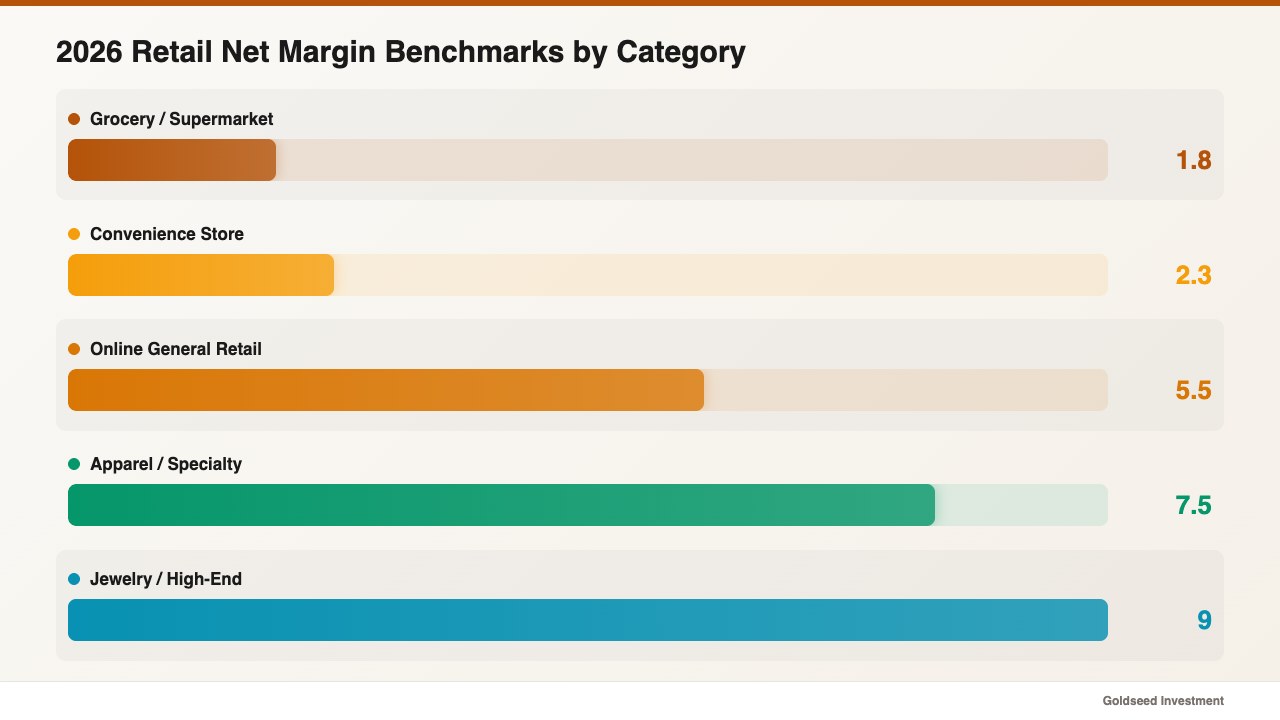
Benchmarks only mean something within your category. A dollar store, a jewelry boutique, and a grocery chain live in completely different margin worlds.
The ranges below are directional, pulled from NYU Stern’s industry margin dataset, U.S. Census retail trade data, and the Deloitte 2026 Retail Outlook:
- Grocery and supermarkets: gross margin tends to sit in the 25–30% range; net margin often lands between 1% and 2.5%.
- Convenience stores: gross margin 28–34% on merchandise (much thinner on fuel); net margin often 1.5% to 3%.
- Apparel and specialty retail: gross margin 45–55%; net margin in many cases 5% to 10%.
- Jewelry and high-end specialty: gross margin 45–55%; net margin 6% to 12% in healthy years.
- Online-only general retail: gross margin 30–40%; net margin often 3% to 8%, though shipping and returns distort both.
The lesson is not to chase someone else’s number. It is to measure your own store against stores that share your category and your footprint. A rural c-store with low rent tends to post a stronger net margin than an identical store in a high-rent urban location, even when their gross margins are identical.
Why Does Gross Margin Often Look Healthy While Net Margin Shrinks?
This is the single question that trips up new retail owners. The gap between the two margins is an operating expense story, and it is rarely about one big line item.
For a typical small retail store, the biggest drags between gross profit and net income are, in order: labor (often 10–16% of sales once overtime, taxes, and benefits are included); rent and occupancy (6–12% of sales depending on location); shrinkage and damage (1–3% of sales); card processing and banking fees (1.5–2.5% of sales); utilities, insurance, software, and supplies (2–5% of sales combined); and interest on credit lines plus taxes.
One retail operator described it plainly: “Revenue felt real. But the cash wasn’t there when we needed it.” That is the net margin speaking. Revenue and gross margin can move in lockstep while net margin quietly slides, because operating expenses often grow faster than sales during an expansion phase.
Wholesale cost inflation matters here too. The BLS Producer Price Index reported wholesale food prices rising 2.4% year-over-year in 2025. Most grocers and c-stores could not pass every cent of that through to the shelf, which compressed gross margin from an average of 29% down to about 27% in that category, at the same time that minimum wage increases were pushing labor costs from roughly 11% of sales to 13%. Both lines moving the wrong way at once is how a store can post stable revenue and still watch net margin erode from 3% to 1.5%.
Which Margin Should a Store Owner Watch Most Closely Each Month?
Both matter, but they answer different questions among your retail profitability metrics.
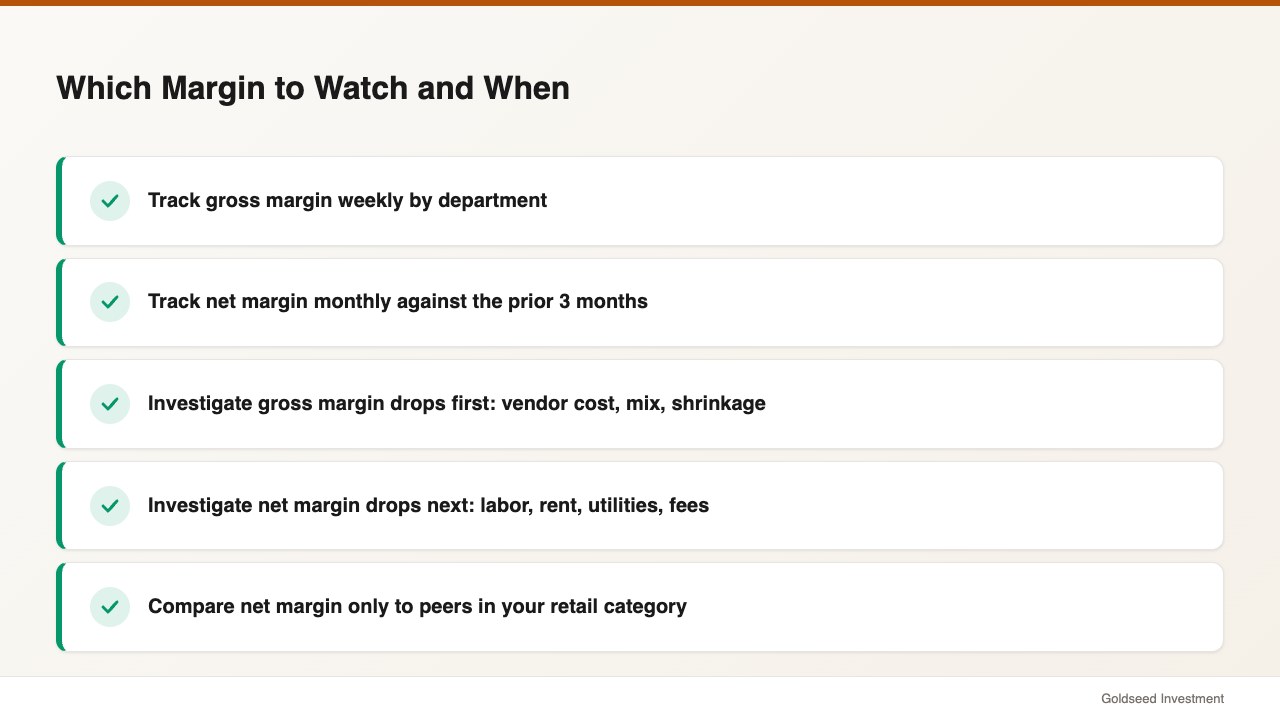
Gross margin is the right number to watch if you suspect a pricing, sourcing, or shrinkage issue. A 200-basis-point drop — say, from 34% to 32% — almost always traces back to one of three things: a vendor raised your cost and you did not raise your retail price, your product mix shifted toward lower-margin SKUs, or shrinkage climbed.
Net margin is the right number to watch if you suspect an operating problem. If your gross margin is holding at 32% but net margin slid from 3% to 1%, the issue is almost certainly labor, rent, utilities, or another operating line — not the products you sell. For a deeper look at the numbers that flow into both lines, see our retail store profitability analysis guide.
In practice, track gross margin weekly by department if your system allows, and track net margin monthly. Weekly gross margin tells you about the store’s purchasing and pricing discipline. Monthly net margin tells you whether the business model is actually working.
How Can You Improve Each Margin Without Killing the Other?
This is where retailers often make the most expensive mistake: they improve one margin by sabotaging the other.
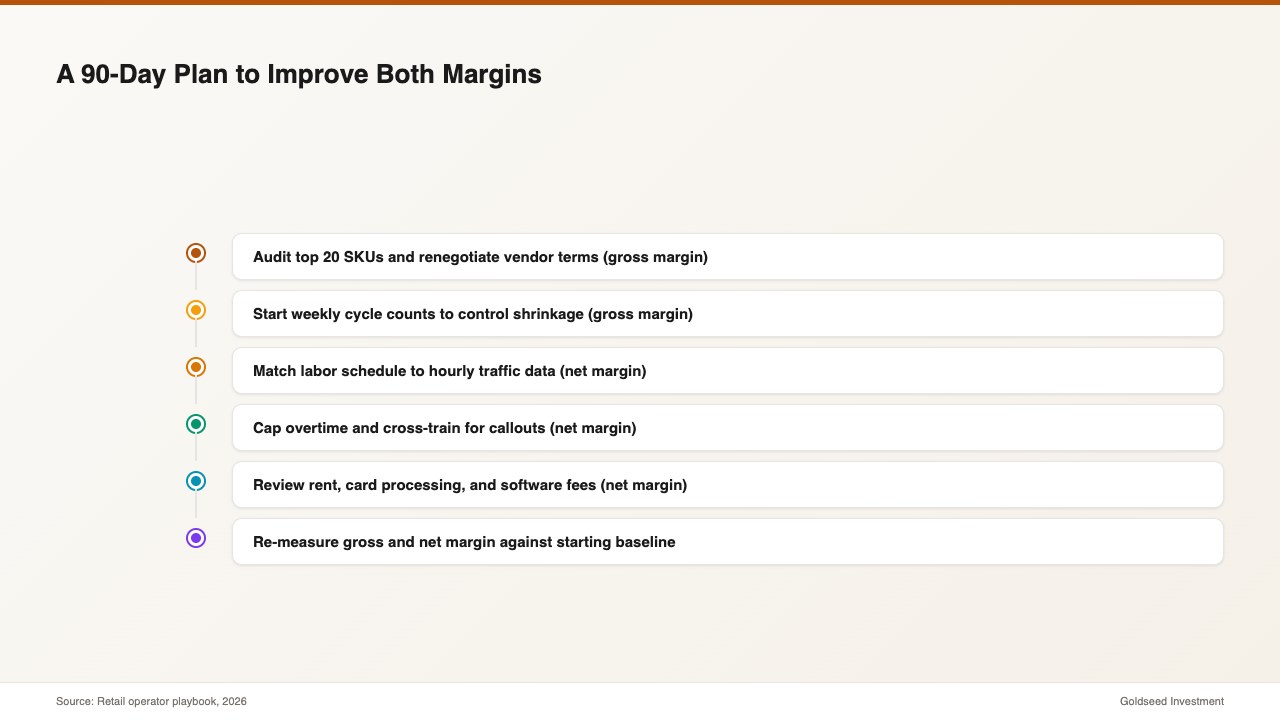
To improve gross margin, the usual levers are vendor terms, product mix, shrinkage control, and pricing. Pull your top 20 SKUs by revenue and ask your vendors for volume pricing. Look at your bottom-margin SKUs and ask whether they are pulling customer traffic or just occupying shelf space. Run a cycle count at least monthly so that shrinkage gets caught early, not at the annual audit when it is already 3% of sales. Stores that move from an annual count to a weekly cycle count often see shrinkage drop from 2.4% to 1.3% within two quarters.
To improve net margin, the levers are almost always operating expenses. Labor is often the fastest one to move. Tighten the schedule to actual traffic patterns, cap overtime, and cross-train so a single caller-out does not force a manager to fill in at overtime rates. Stores that match schedules to hourly traffic data often cut labor from 14% of sales to 11%, which flows straight through to net margin. Review rent at every renewal cycle. Shop card processing rates every two years. Audit software subscriptions annually.
The trap is cutting cost of goods at the expense of the customer experience. If you trim COGS by switching to a lower-quality private label, your gross margin may tick up briefly from 32% to 34%, but your repeat traffic often falls 5–8% and net margin drops harder because fixed costs stay the same on lower revenue. Similarly, cutting labor so aggressively that checkout lines stretch past three customers tends to drive shoppers to the store across the street — again hitting net margin through the top line.
The rule of thumb: gross margin improvements should come from the supply side (vendors, mix, shrinkage), and net margin improvements should come from the operating side (labor, rent, utilities). When you try to fix one with tools meant for the other, you often make both worse.
What Common Mistakes Distort Margin Numbers in Retail?
Even experienced owners misread their own margins, often in the same handful of ways.
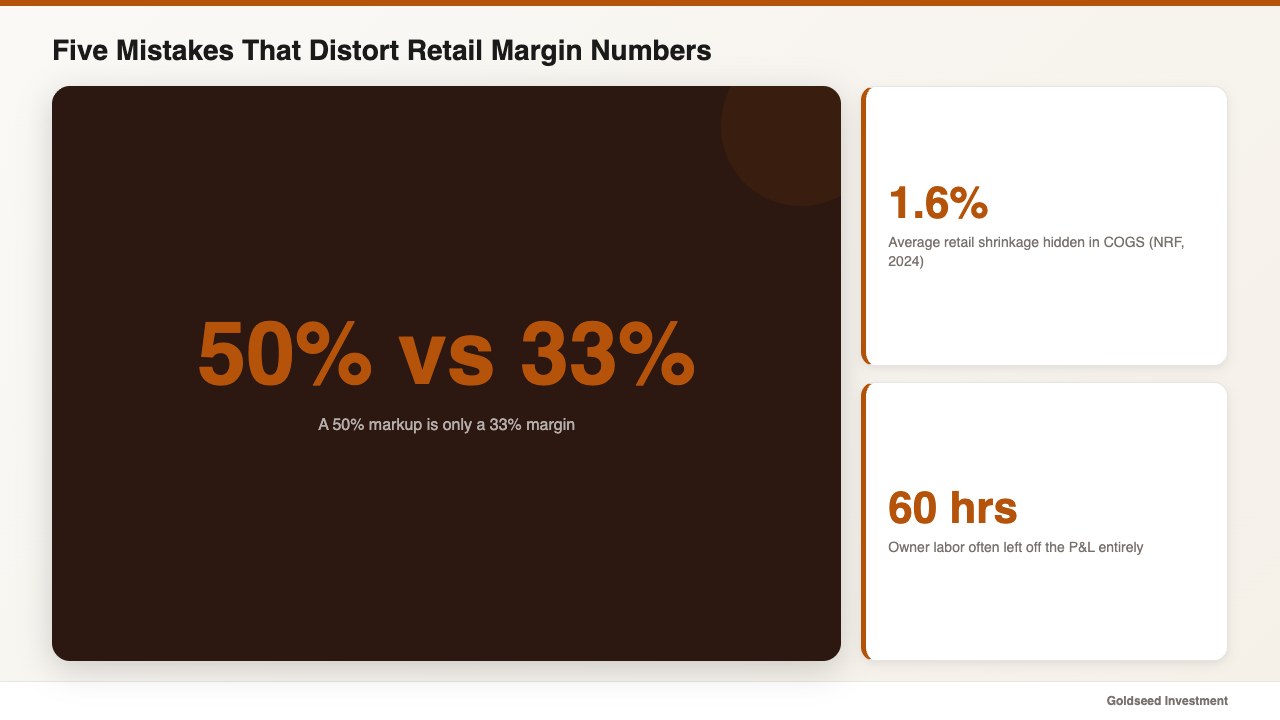
The first is confusing markup and margin. A 50% markup on a $2 cost gives you a $3 retail price, but the margin is 33%, not 50%. Vendors often quote markups while accountants quote margins, and the difference is big enough to rewrite a purchasing decision.
The second is leaving freight-in, vendor chargebacks, or rebates out of COGS. If you pay freight on inbound inventory and book it as an operating expense, your gross margin looks artificially high and your operating margin looks artificially low. The IRS Publication 334 guidance is clear that freight-in belongs in COGS.
The third is not counting owner draw or family labor. A store where the owner works 60 hours a week for no formal paycheck is not as profitable as the P&L suggests. Book a reasonable wage for every working owner or family member. If you do not, you cannot compare your store’s net margin to benchmarks built on stores that do pay their operators.
The fourth is ignoring shrinkage in COGS. If your system shows 50 units on hand but you count 42, that 8-unit gap is real cost that already hit your gross margin — but only if you wrote it off. Stores that do an annual physical and dump a one-time shrinkage adjustment into December tend to see distorted margins for eleven months and a shock in the twelfth.
The fifth is comparing to the wrong peer group. A c-store owner benchmarking against specialty retail will feel bad for no reason. For the right peer numbers, see our retail profit margin benchmark guide by category.
FAQ
Q: Is gross margin or net margin more important for a retail store? A: Both matter, but they answer different questions. Gross margin tells you whether your pricing and sourcing are healthy. Net margin tells you whether the business itself is profitable. Use gross margin for weekly purchasing and pricing decisions, and net margin for monthly business-health reviews.
Q: What is a good net profit margin for a small retail store in 2026? A: A typical small retail store runs a net margin between 2% and 5%, depending on category. Grocery and c-stores tend to be on the lower end (1.5%–3%), while apparel and specialty often sit at 5%–10%. Anything consistently below 1.5% suggests an operating expense problem worth investigating.
Q: How is gross margin different from markup? A: Markup is the percentage added to cost to reach the retail price. Margin is the percentage of revenue retained after cost. A 50% markup equals only a 33% margin. Confusing the two is one of the most common pricing errors in retail.
Q: Can a store have a high gross margin and still go bankrupt? A: Yes. Many stores with healthy gross margins fail because their operating costs — especially labor, rent, and shrinkage — consume too much of the gross profit. A 45% gross margin with a 48% operating expense ratio means the store is losing money on every sale.
Q: Does shrinkage show up in gross margin or net margin? A: Shrinkage reduces gross margin because it is recorded inside cost of goods sold. The NRF reported average retail shrinkage of 1.6% of sales in 2024, meaning a store doing $1M in revenue loses roughly $16,000 of gross profit before any operating expenses are considered.