Retailers that track the right KPIs across all locations catch underperforming stores 60 days earlier and reduce same-store cost variance by up to 23%.
One multi-location retail operator described it plainly: “Every time I wanted to know what was happening at a location, I had to physically go there. By the time I had the numbers cleaned up, the week was half over.”
That problem is not unusual. Most owners who expand from one store to two, three, or ten discover the same thing: the retail store performance metrics that worked for a single location stop working the moment you add a second. Revenue appears healthy in aggregate, but individual stores drift in silence. A high-performing location masks a quietly struggling one. By the time the problem is visible, it has been compounding for months.
The fix is not more data — it is the right KPIs for multi-location retail stores, reviewed at the right cadence. This guide covers 12 essential retail chain performance indicators, the industry benchmarks behind each, and a practical framework for cross-location comparison in 2026.
Why Do Most Multi-Location Retailers Track the Wrong KPIs?
The most common mistake among multi-store operators is tracking consolidated revenue instead of per-location profitability. Combined revenue looks strong even when one store is dragging margins down. That is the accounting equivalent of averaging a healthy patient with a sick one and calling both fine.
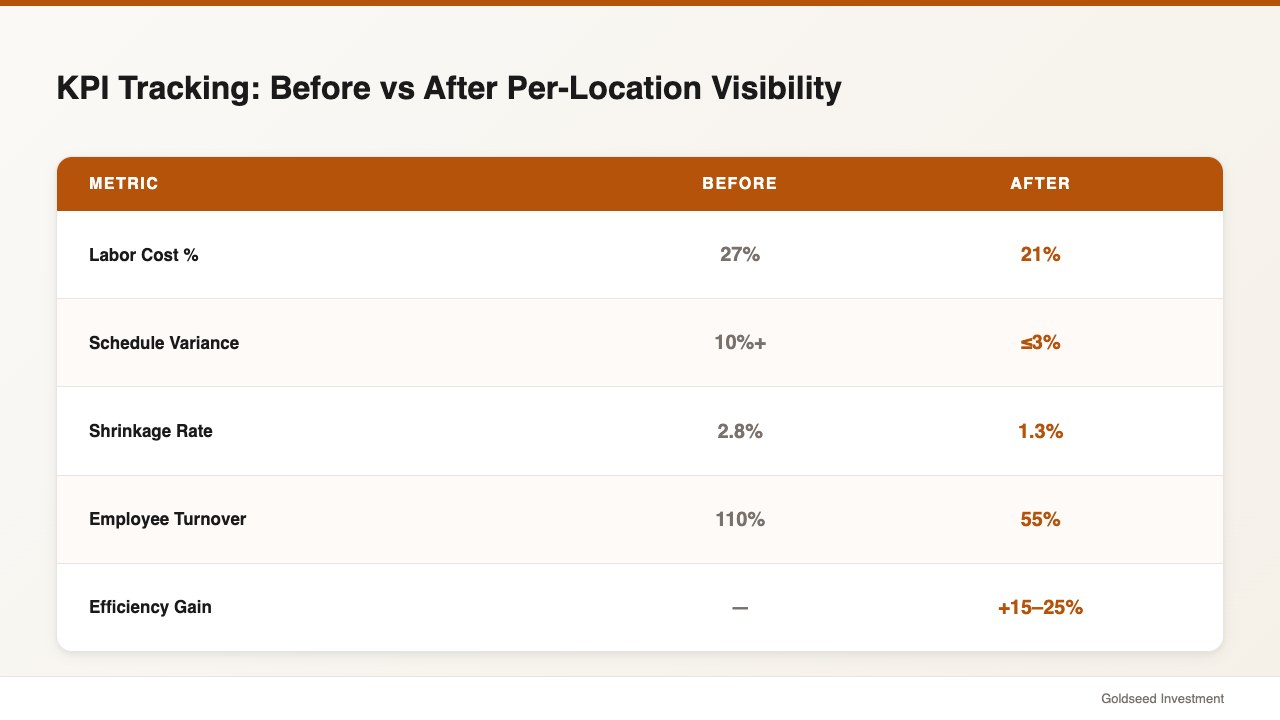
A 2024 McKinsey analysis of retail analytics found that retailers using real-time, location-level analytics reported 15–25% improvements in operational efficiency — but the majority of small chain operators still rely on monthly spreadsheet roll-ups that are 3–4 weeks stale before anyone reads them. For retailers who switched from aggregate-only reporting to per-location dashboards, average labor cost percentage dropped from 27% to 21% within six months.
The second mistake is data fragmentation. Scheduling data lives in one app, inventory in another, payroll in a third. When multi-store retail benchmarks cannot be assembled without manually stitching spreadsheets together, decisions default to gut feel.
The third mistake is comparing stores without context. A 1,200-square-foot location in a strip mall and a 3,000-square-foot urban flagship have different cost structures, traffic patterns, and labor needs. Raw revenue comparisons mislead. Per-square-foot and percentage-of-revenue metrics tell the real story.
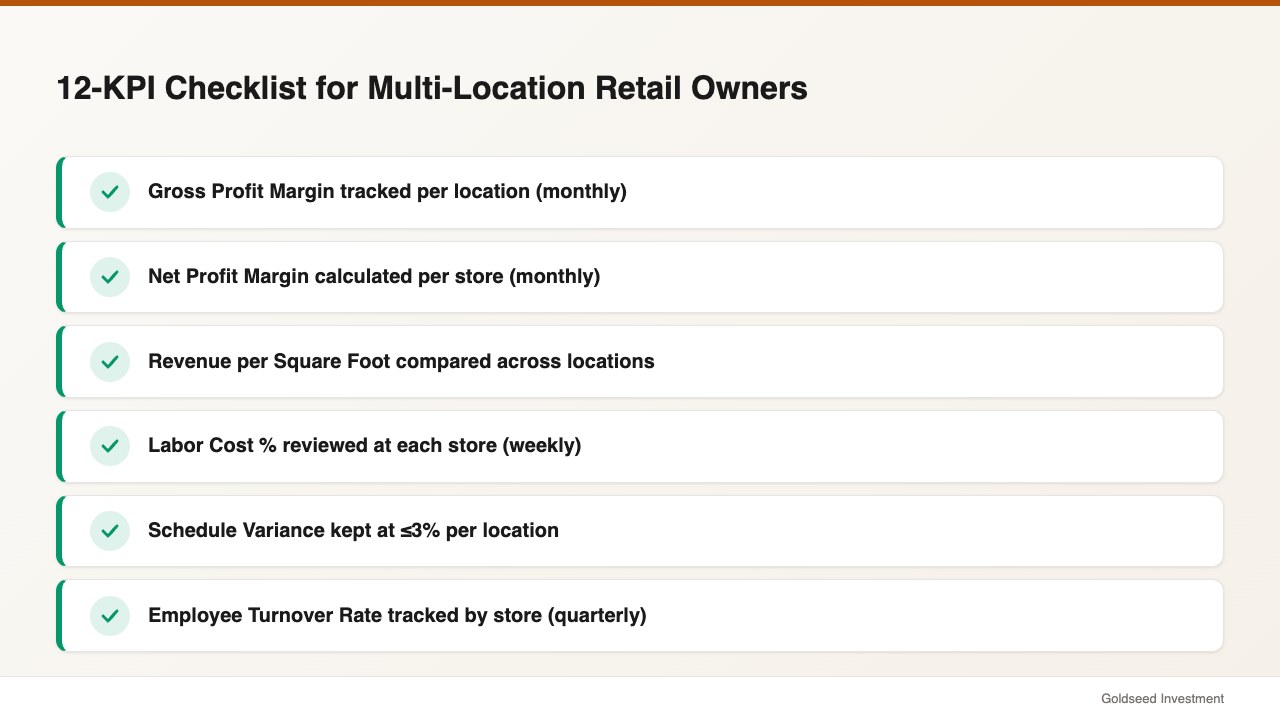
The 12 KPIs below are grouped into three categories: financial, operational, and inventory. Each is measurable at the location level and comparable across your chain.
Which Financial KPIs Should Every Multi-Store Owner Monitor?
1. Gross Profit Margin by Location
Formula: (Revenue − COGS) ÷ Revenue × 100
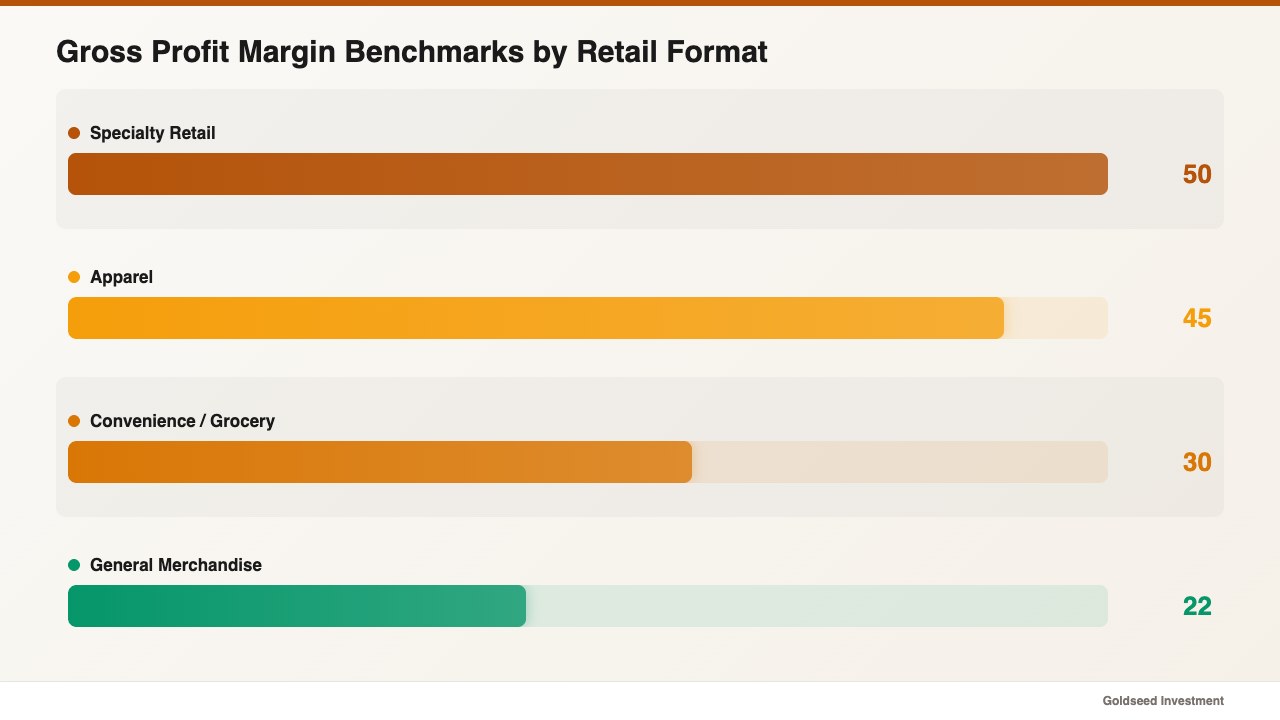
Benchmark: 40–60% for specialty retail; 25–35% for convenience and grocery formats (NRF, 2024).
Gross margin is the foundation of how to measure retail store performance at the location level. A location with strong revenue but thin margins may be discounting too aggressively, absorbing freight costs differently, or selling a different product mix than intended. Comparing gross margins across locations reveals pricing inconsistencies before they erode profitability chain-wide.
Review frequency: Monthly minimum; weekly for stores showing ±3% variance from the chain average.
2. Net Profit Margin per Store
Formula: Net Income ÷ Revenue × 100
Benchmark: 2–6% for small retail formats; 8–12% for specialty stores with controlled labor costs.
Net margin accounts for all operating expenses including rent, labor, and utilities — making it the true test of whether a location is self-sustaining. An unprofitable store does not always mean low revenue; it often means uncontrolled fixed costs. For more on analyzing profitability at the store level, see how to analyze retail store profitability in 5 steps.
3. Revenue per Square Foot
Formula: Annual Revenue ÷ Total Retail Square Footage
Benchmark: $300–$500 for apparel; $400–$700 for specialty food; $150–$300 for general merchandise (NRF industry data, 2024).
This metric is particularly useful for multi-location operators because it normalizes for store size. A 2,000 sq ft location generating $600K and a 4,000 sq ft location generating $1.2M are performing identically on a per-square-foot basis — a fact that would be invisible in a pure revenue comparison.
4. Operating Cost as a Percentage of Revenue
Formula: Total Operating Expenses ÷ Revenue × 100
Benchmark: 35–50% for most small-format retail; labor alone typically accounts for 15–30% (NRF, 2024).
This KPI flags cost creep before it becomes a margin crisis. If one location’s operating cost ratio drifts from 42% to 48% over a quarter, something specific changed — a lease renewal, a staffing addition, or a utility spike. Catching it early prevents a 6-point margin hit from becoming permanent.
| KPI | Benchmark | Review Frequency |
|---|---|---|
| Gross Profit Margin | 40–60% (specialty) | Monthly |
| Net Profit Margin | 2–6% (small format) | Monthly |
| Revenue per Sq Ft | $300–$700 | Quarterly |
| Operating Cost % | 35–50% | Monthly |
| Labor Cost % | 15–30% | Weekly |
| Schedule Variance | ≤3% | Weekly |
| Employee Turnover | ≤40% annually | Quarterly |
| Avg Transaction Value | Category-specific | Weekly |
| Same-Store Sales Growth | +2–5% annually | Monthly |
| Inventory Turnover | 4–8x annually | Monthly |
| Shrinkage Rate | ≤1.44% | Quarterly |
| Sell-Through Rate | ≥65% | Monthly |
Source: NRF National Retail Security Survey 2023; BLS Occupational Outlook 2024; NRF State of Retail 2024
What Operational KPIs Reveal About Day-to-Day Performance?
5. Labor Cost Percentage
Formula: Total Labor Cost ÷ Revenue × 100
Benchmark: 15–30% depending on store format and region (NRF, 2024).
Labor is the most controllable cost in retail and the most frequently mismanaged in multi-location operations. A manager who runs loose on scheduling at one location can quietly add 3–5 percentage points to that store’s labor cost — invisible in aggregate until margins compress. In practice, operators who moved labor cost tracking from monthly to weekly at each location reduced unplanned overtime by 18–22% within the first quarter. Track labor cost percentage at each location weekly, not monthly.
6. Schedule Variance
Formula: (Actual Labor Hours − Scheduled Hours) ÷ Scheduled Hours × 100
Benchmark: ≤3% variance; above 5% indicates a systemic scheduling problem.
Schedule variance measures how well planned labor matches actual labor. A 10% positive variance — where a store consistently runs more hours than scheduled — may indicate poor shift management, excessive overtime approvals, or managers accommodating untracked shift swaps. Left unaddressed, a 10% variance in a 20-employee store can cost $15,000–$30,000 annually in unplanned labor. Stores that brought schedule variance from 10% down to 3% recovered that full cost savings within a single fiscal year.
For deeper context on managing labor across stores, see how to manage two retail stores at once.
7. Average Transaction Value (ATV)
Formula: Total Revenue ÷ Number of Transactions
Benchmark: Varies widely by category; the important metric is consistency across locations and trend over time.
ATV differences between locations often reveal training gaps. If one store’s ATV is consistently 15% below another with similar traffic and product mix, staff at the underperforming location may not be upselling, or customers may be experiencing checkout friction that cuts basket size. Investigate before assuming the lower location is in a weaker market.
8. Same-Store Sales Growth (Comp Store Sales)
Formula: (Current Period Sales − Prior Period Sales) ÷ Prior Period Sales × 100
Benchmark: +2–5% annually for healthy small retail chains.
Same-store sales growth isolates organic performance from expansion. If aggregate revenue grows 20% because you opened two new locations, same-store growth of −3% is buried in the headline number. Public retail chains report this metric every quarter because investors know it tells the real story. Owner-operators running 2–5 locations should treat it the same way.
How Do Top Retail Chains Track Labor Efficiency Across Locations?
Labor is where multi-location operations tend to diverge most sharply — and where problems are most often invisible until they are expensive.
9. Employee Turnover Rate by Location
Formula: Number of Separations ÷ Average Headcount × 100
Benchmark: The U.S. retail average is approximately 60% annually (BLS Occupational Outlook, 2024). Best-in-class small chains operate below 40%.
Employee turnover is a leading indicator, not a lagging one. A store with a 90% annual turnover rate is signaling a management, culture, or compensation problem 60–90 days before it shows up in customer satisfaction or revenue metrics. Gallup research suggests stores in the top quartile for employee engagement show 21% higher profitability — making turnover one of the highest-leverage KPIs on this list. Chains that began tracking turnover by individual location rather than chain-wide average identified their highest-attrition store within 30 days and reduced its turnover rate from 110% to 55% within two quarters through targeted management intervention.
The key action is to track turnover at the individual location level. A chain average of 55% is meaningless if one location runs at 20% and another at 110%. The underperforming location needs a specific intervention, not a chain-wide policy change.
10. Labor Hours per Transaction
Formula: Total Labor Hours ÷ Number of Transactions
This metric captures staffing efficiency. A location requiring 0.8 labor hours per transaction when others average 0.5 may be overstaffed at non-peak hours, or may have a different traffic pattern that warrants investigation rather than assumption.
One retail operator managing multiple locations put it plainly: “Every time I wanted to know what was happening at a location, I had to physically go there. By the time I had the numbers cleaned up, the week was half over. The goal isn’t more data — it’s having the right number visible before you even think to ask the question.”
This isn’t a knowledge problem. It’s a tools problem. Most store owners face the labor efficiency blind spot not because they are inattentive, but because the data was never organized to make this comparison easy at a glance.
Which Inventory KPIs Are Critical for Multi-Location Stores?
11. Inventory Turnover Rate
Formula: COGS ÷ Average Inventory Value
Benchmark: 4–8 times annually for most retail formats; convenience stores can run 12–20x.
Low inventory turnover — below 4x — often indicates excess stock tying up cash that could be deployed elsewhere. High turnover above 10x may signal stockouts that cost sales. The goal is not the highest possible turnover; it is consistent turnover across locations, with outliers investigated rather than ignored.
For operators managing a convenience store format, see convenience store profit and loss guide with 2026 benchmarks for context on how turnover links to P&L performance.
12. Shrinkage Rate
Formula: (Recorded Inventory − Actual Inventory) ÷ Recorded Inventory × 100
Benchmark: 1.44% of sales on average, representing $112.1 billion in losses industry-wide (NRF National Retail Security Survey, 2023).
Shrinkage is the most watched inventory KPI in retail chains for good reason. A 1.44% shrinkage rate on a $500K location is $7,200 lost annually — at every location. The multi-store complexity is attribution: when shrinkage is reviewed only at the chain level, high-shrinkage locations are disguised by low-shrinkage ones. Individual location tracking tends to reveal that shrinkage clusters around specific shifts, specific product categories, or specific receiving windows — each pointing to a different root cause. Operators who moved from annual chain-level shrinkage reviews to quarterly per-location reviews reduced their highest-shrinkage store’s loss rate from 2.8% to 1.3% within a year.
A related metric worth tracking alongside shrinkage is sell-through rate: (Units Sold ÷ Units Received) × 100. A benchmark of 65%+ is considered healthy for most retail formats. A location with strong inventory turnover but low sell-through may be over-ordering fast-moving items while slow-moving SKUs accumulate.
How Can Cross-Location Benchmarking Improve Your Weakest Store?
The most underused advantage of running multiple retail locations is the internal benchmark. You do not need industry data to know if a store is underperforming — you just need to compare it to your best one.
A practical cross-location benchmarking process has three components:
1. Establish a performance baseline from your strongest location. Pull all 12 KPIs for your highest-margin, most stable store. That becomes the internal benchmark — not aspirational, but actually achievable within your own business model. This is the starting point of any rigorous multi-store retail benchmarks exercise.
2. Set a review cadence. Daily KPIs (cash drawer variance, labor hours) need daily review. Weekly KPIs (schedule variance, ATV, same-store sales) need weekly review. Monthly and quarterly KPIs (gross margin, net margin, turnover rate) need monthly review. The most common failure is reviewing all KPIs on the same cycle — usually monthly — which means daily operational problems go undetected for 28 days.
3. Investigate differences before acting on them. A store with a 5-point lower gross margin than your benchmark may have a different product mix, a different lease arrangement, or simply a different customer demographic. Cross-location benchmarking starts with a question, not a conclusion. The question is: “Why is this different?” — not “Why is this wrong?”
Retailers that implement this three-step framework tend to find that 80% of their underperformance concentrates in 20% of their KPIs. Fix the two or three metrics that are genuinely out of line before optimizing the ones that are already in range.
Common KPI Mistakes Multi-Location Retailers Make
Tracking too many metrics. Twelve KPIs is a ceiling, not a floor. Owners who report 30+ retail store performance metrics tend to review none of them consistently. Start with the four financial KPIs. Add operational and inventory metrics as your reporting infrastructure matures.
Not separating controllable from uncontrollable variance. A location in a shopping center undergoing construction will see traffic decline — that is not a management failure, and punishing a store manager for it destroys morale. Distinguish between KPI changes you can act on and those driven by external conditions.
Reviewing KPIs too infrequently. Monthly KPI reviews catch problems that have been compounding for 29 days. High-velocity metrics — labor cost percentage, schedule variance, cash variance — need weekly reviews at minimum. Daily reviews are not excessive for stores with high shrinkage history or recent management changes.
Comparing stores without context. A 600-square-foot location in a transit hub and a 2,500-square-foot suburban strip mall have structurally different cost and revenue profiles. Always normalize comparisons by revenue-per-square-foot, labor-cost-percentage, and per-transaction metrics before drawing conclusions from raw numbers.
FAQ
Q: What KPIs matter most for a 2-store retail chain? A: For an owner managing two locations, the highest-priority retail chain performance indicators are gross profit margin by store, labor cost percentage, and employee turnover rate. These three together capture the financial health, cost control, and staffing stability that tend to diverge first when a second location is added. Add schedule variance and shrinkage rate once you have the first three tracked consistently.
Q: How often should I review KPIs across my locations? A: Daily: cash drawer variance. Weekly: labor cost %, schedule variance, same-store sales, ATV. Monthly: gross margin, net margin, inventory turnover, sell-through rate. Quarterly: employee turnover, revenue per square foot, shrinkage rate. Most owners start with weekly reviews of all metrics and tighten the cadence as they identify which metrics are most volatile in their specific business. For a framework on building store-level financial visibility, see how to analyze retail store profitability in 5 steps.
Q: Can I run two stores with just one manager? A: In many cases, yes — but the answer depends heavily on which KPIs you have visibility into. A single manager covering two locations needs clear daily reporting on cash variance, scheduling compliance, and any inventory discrepancies. Without that visibility, the manager’s attention will default to whichever location has the most immediate fire, and the quieter location drifts. The operators who successfully run two or more stores on lean staffing tend to invest in reporting infrastructure first, then reduce on-site management hours gradually as the data validates stability. See how to manage two retail stores at once for a practical breakdown.