The top quartile of multi-store convenience operators run 18% lower inventory carrying costs than single-store owners — and the gap widens every year a chain stays unsystematized.
The second location was always the plan. But every time Aisha Patel — owner of a single profitable convenience store outside Houston — got close to opening it, the same thought stopped her: “If I’m not at the first store, who’s watching the numbers?” She wasn’t afraid of growth. She was afraid the first store couldn’t run without her standing in it. That’s not a staffing problem. That’s a systems problem — and it’s the central challenge behind the most useful convenience store chain management tips for any operator running between two and ten locations.
This guide covers seven tested tactics for multi-store convenience store management — drawn from how high-margin chains actually operate in 2026. Each tip targets a specific failure pattern that tends to appear at a predictable store count.
Why Do Most Convenience Store Chains Plateau at 3 Locations?
Three is the number where personal management stops working. According to the NACS State of the Industry Annual Report 2024, the U.S. has roughly 152,396 convenience stores, and the median multi-store operator runs between 3 and 12 stores. The gap between operators who get past three and those who stall is rarely about capital — it’s about decision latency.
A single-store owner can hold the entire operation in their head. The reorder schedule, the cash patterns, who shows up on time, which SKUs are slow movers. By the second store, that mental model usually still works if the owner is on-site daily. By the third store, it fails. The owner can no longer be physically present, and decisions that used to take minutes now take days because information flows through phone calls and texts.
The cost of decision latency in a c-store format is unusually high. Margins are thin — net margin generally sits at 1–3% for convenience formats. A single shrinkage problem that takes two weeks to surface, or a vendor pricing mistake that lingers for a month, can wipe out the contribution margin from an entire location. Multi-store convenience store management requires turning what was personal observation into structured signal.
How Is Multi-Store Management Different from Running One Store?
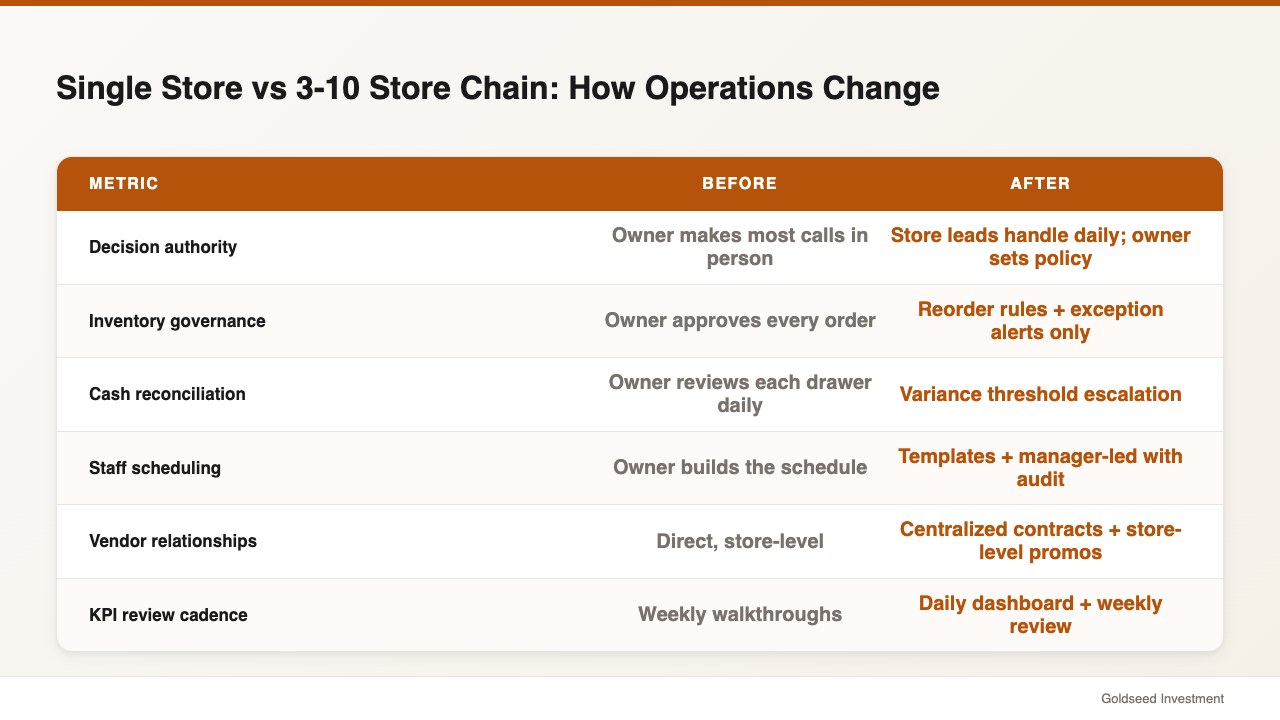
The shift from one store to a chain is not a quantitative change. It’s a structural one. Below is how the operating model usually changes:
| Operating Dimension | Single Store | 3-10 Store Chain |
|---|---|---|
| Decision authority | Owner makes most calls in person | Store leads handle daily; owner sets policy |
| Inventory governance | Owner approves every order | Reorder rules + exception alerts only |
| Cash reconciliation | Owner reviews daily | Variance threshold escalation |
| Staff scheduling | Owner builds the schedule | Templates + manager-led with audit |
| Vendor relationships | Direct, store-level | Centralized contracts + store-level promos |
| KPI review cadence | Weekly walkthroughs | Daily dashboard + weekly review |
Source: NACS Magazine — Multi-Store Operations 2025
Notice the pattern: every single-store activity becomes a system in a chain. A useful working definition of c-store chain management best practices is this: any decision that needs to happen at every store, every day, must be turned into a rule rather than a judgment call. Rules scale. Judgment calls don’t.
Tip #1 — How Do You Standardize SKU Management Across Stores?
SKU rationalization is the highest-leverage starting point for any chain past two stores. The typical convenience store carries 2,500–3,500 SKUs, and once you have multiple locations, fragmentation creeps in fast. One store starts ordering a different vendor’s coffee creamer because a regular customer asked. Another keeps three energy drink flavors no one buys. Within a year, the chain often carries 4,500 unique SKUs across stores — most of which sell in only one or two locations.
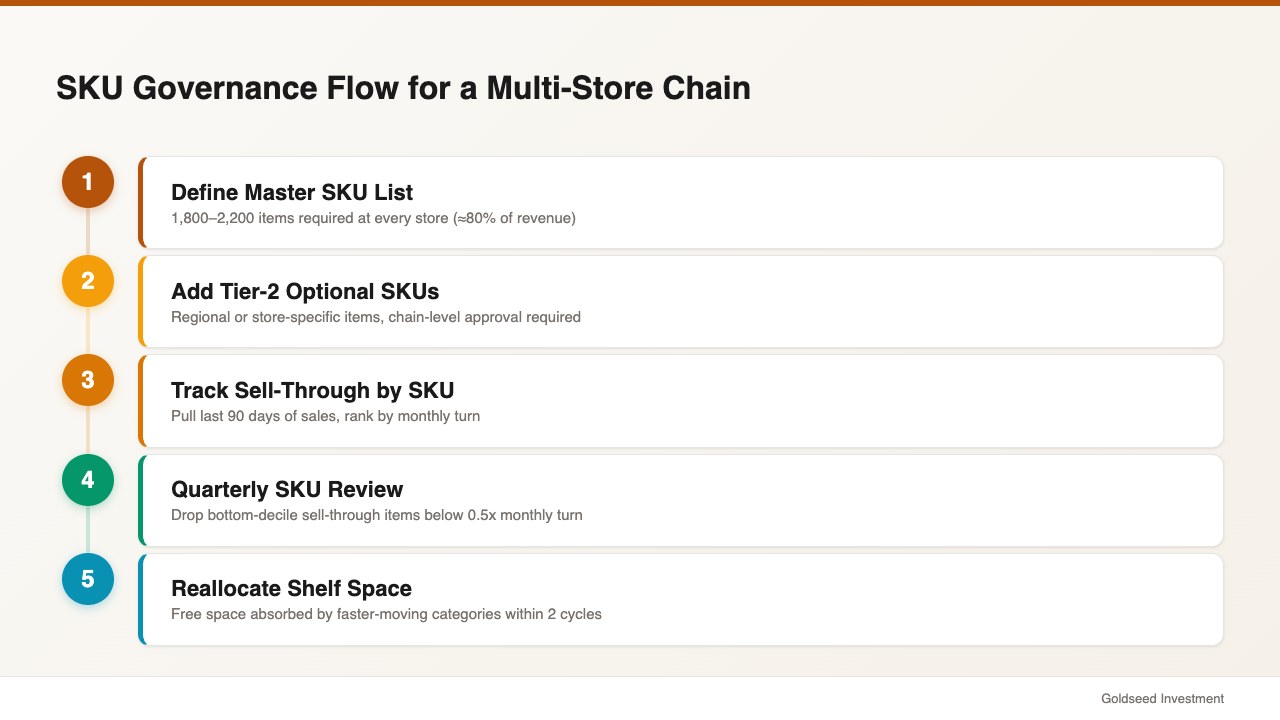
A workable governance framework looks like this. First, build a master SKU list of products carried in every store — usually 1,800–2,200 items that drive 80% of revenue. Second, define a tier-2 list of regional or store-specific items that an individual store manager can request, but that must be approved at the chain level. Third, run a quarterly review that drops bottom-decile sell-through items.
Pull your last 90 days of sales data and rank SKUs by sell-through rate. Items below 0.5x monthly turn — meaning they sell less than half their stocked quantity per month — are usually candidates for delisting. The freed shelf space tends to absorb into faster-moving categories within two cycles. According to NACS magazine reporting from 2025, top-quartile c-store operators reduce inventory carrying costs by roughly 18% through this kind of central SKU governance.
Tip #2 — Which Cash Reconciliation Process Catches Theft Earliest?
Cash variance is where most multi-store fraud appears, and it tends to be detectable weeks before it shows up in inventory shrinkage. The reason is that cash patterns have less natural variance than inventory counts. A drawer that’s $12 short on a Tuesday and $8 over on a Wednesday is normal. A drawer that’s $20–$40 short on the same shift, three weeks running, is not.
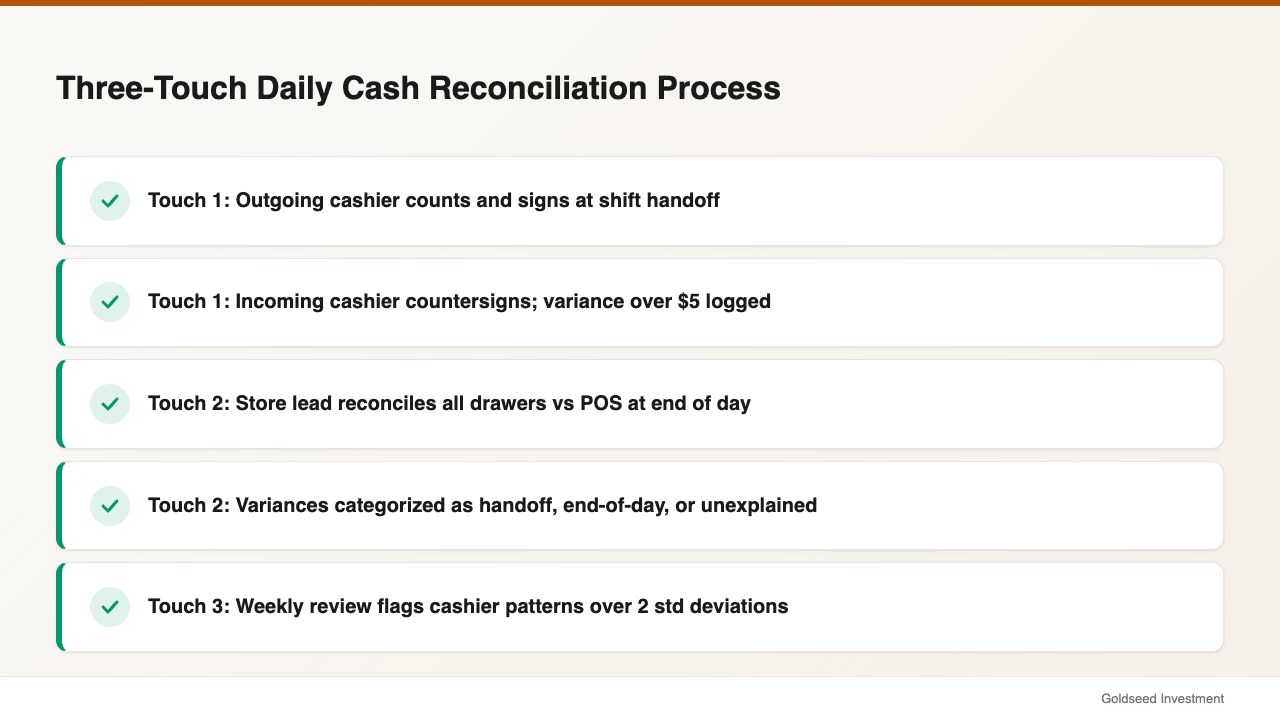
A three-touch daily reconciliation tends to surface problems early:
- Touch 1 — Shift handoff: outgoing cashier counts and signs; incoming cashier countersigns. Any variance over a $5 threshold is logged immediately, not at end of day.
- Touch 2 — End of day: store lead reconciles all drawers against POS reports. Variances are categorized: shift-handoff (caught at Touch 1), end-of-day (new variance), or unexplained.
- Touch 3 — Owner or district manager review: weekly trend analysis flags any cashier or shift consistently outside two standard deviations.
The statistical piece often matters more than the daily count. One operator put it this way: when discrepancies appear randomly across cashiers and shifts, they’re usually counting errors. When the same name appears in the variance log three weeks running, the data tends to suggest something deliberate. Loss prevention in convenience formats is largely about pattern recognition, and pattern recognition needs structured data.
For broader context on financial controls across multiple locations, the convenience store P&L benchmarks for 2026 owners covers the cash and revenue lines that interact with reconciliation discipline.
Tip #3 — How Should You Scale Shift Scheduling Without Burning Out Managers?
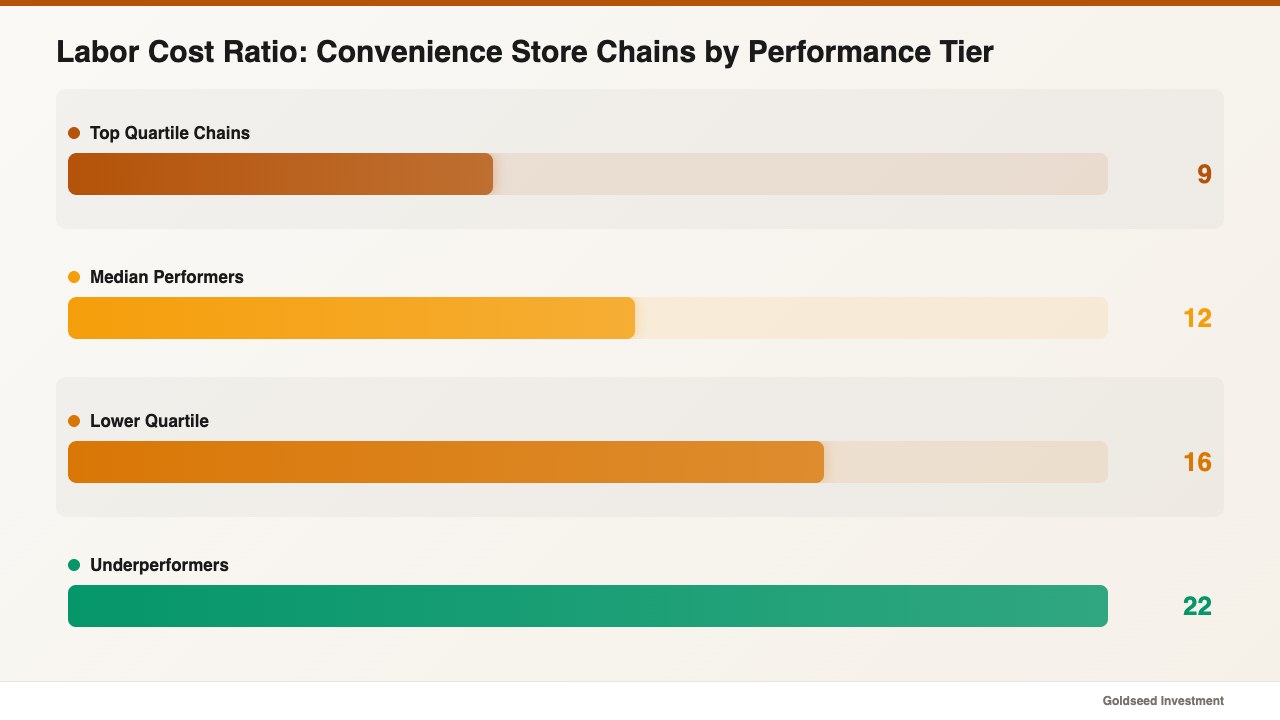
Schedule variance — the gap between scheduled labor and actual labor — is one of the largest hidden costs in multi-store operations. The U.S. Bureau of Labor Statistics retail trade data suggests labor cost ratio benchmarks of 8–14% of revenue for convenience formats, but most chains running at 18%+ are bleeding labor through unmanaged overtime, no-call coverage, and last-minute shift-swap chaos.
The scheduling system that scales tends to have three components:
First, a demand-based template that maps store traffic patterns to staffing levels. Most c-stores have predictable traffic curves — morning commute, lunch, after-work, late-night — that don’t change much week over week. Build a base schedule template per store, per day-of-week, that accounts for these curves and matches FTE deployment to demand.
Second, a self-service shift-swap policy with rules. Employees can swap shifts within their store as long as both employees meet skill requirements (cash drawer trained, food service certified) and the swap doesn’t create overtime. Manager approval becomes exception-based.
Third, a cross-store coverage pool for emergencies. When one store is short and another is overstaffed for the same shift, the system should suggest a transfer. This usually only works once you have four or more stores in reasonable geographic proximity.
Pull your last six weeks of schedule variance data. If actual labor exceeds scheduled labor by more than 6%, your overtime threshold management is breaking down — and most owners find this is happening at one or two specific stores, not chain-wide.
Tip #4 — What Daily Reports Should Every Multi-Store Owner Read?
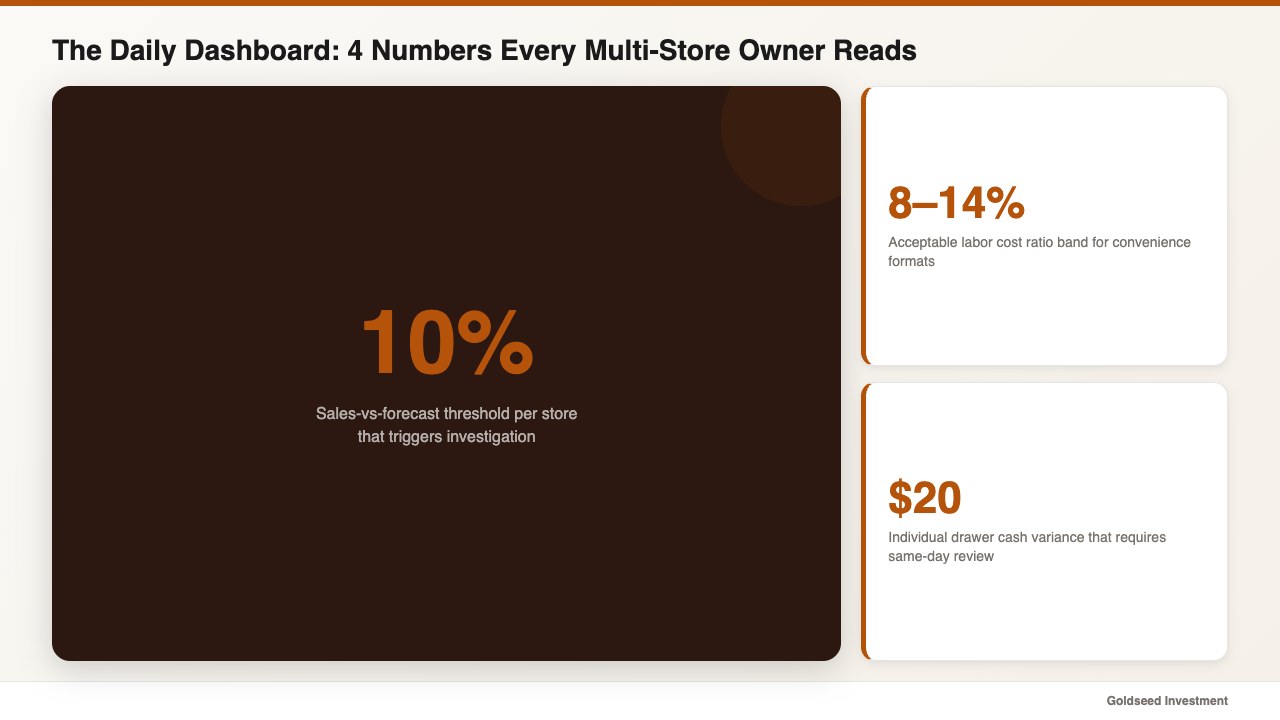
The minimum daily dashboard for a 3+ store chain has four components:
- Sales vs forecast per store — flag any store more than 10% under
- Labor ratio per store — flag any store outside the 8–14% band
- Inventory variance alerts — any cycle count discrepancy above threshold
- Cash variance summary — total dollar variance and any individual drawer over $20
Reading these four numbers takes about ten minutes. The goal isn’t to react to every data point — it’s to catch the outliers that tend to indicate a real operational issue. A store that runs 9% labor ratio for three weeks and then jumps to 16% is signaling something specific: a manager change, a scheduling failure, or a sales drop that hasn’t been adjusted to.
One retail operator managing multiple locations put it plainly: “Every time I trained someone, I was betting months of time on a person who might leave in six months. The only way to scale wasn’t better people — it was putting the knowledge into the system.”
That’s the underlying logic of a daily dashboard. The data already exists at every store. The job of multi-store management is to surface the signals that matter, in a form that takes minutes rather than hours to read. The guide to analyzing retail store profitability has a full breakdown of the metrics that connect daily operations to profitability outcomes.
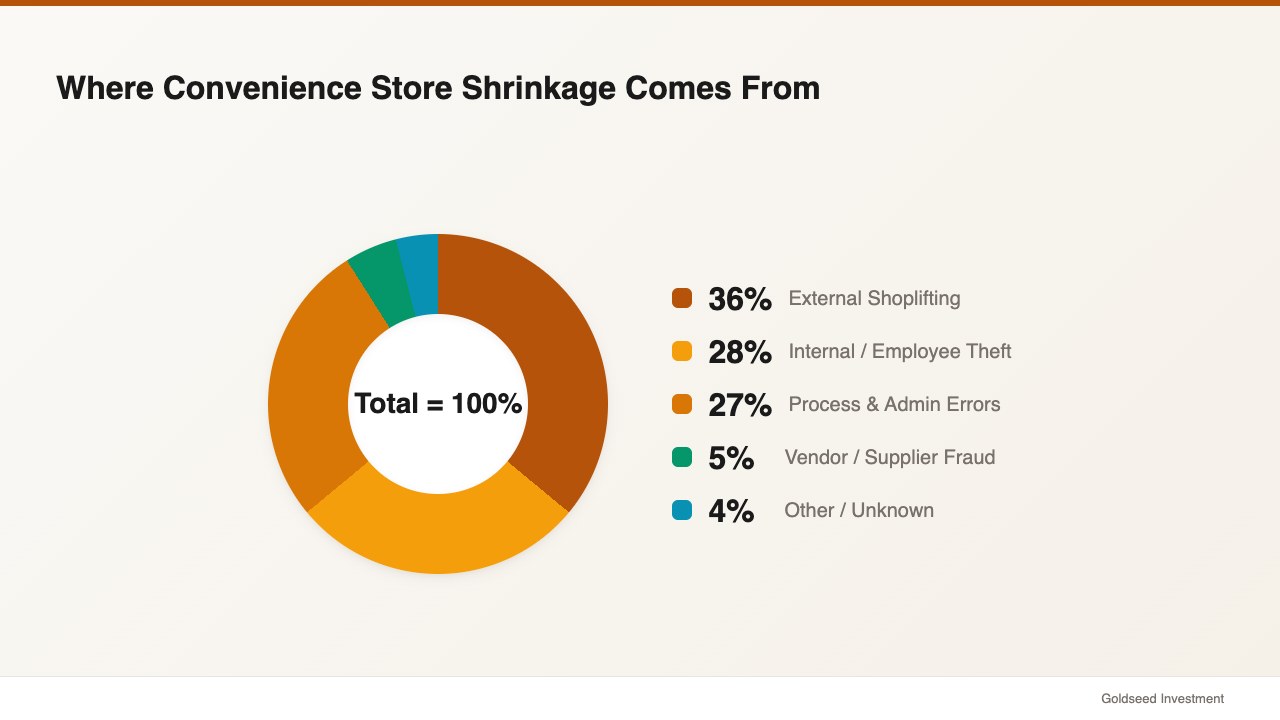
Tip #5 — How Do You Catch Inventory Shrinkage Across Multiple Stores?
Convenience format shrinkage rate tends to run between 2.0% and 2.4% of revenue, according to the NRF National Retail Security Survey 2024 — higher than the 1.6% retail average. For a 5-store chain doing $1.78M average per-store revenue, a single percentage point of excess shrinkage equals roughly $89,000 in annual lost margin.
Multi-store shrinkage detection works differently from single-store. The most useful technique is cross-store pattern analysis. If beverage shrinkage at one store is 2.8% while the chain average is 2.0%, that’s a single-store operational issue. If beverage shrinkage spiked across all five stores during the same two-week period, the issue is more likely a vendor receiving error or a system problem.
Cycle counting is the operational backbone. A workable cadence for c-stores is to count one category per week — beverages, tobacco, snacks, dairy, prepared food, beer/wine if licensed, household goods, automotive — rotating through the assortment in roughly an eight-week loop. This catches problems within a month, rather than waiting for a full annual physical inventory.
Build the audit trail end to end: order placed → vendor confirmation → delivery received → put-away count → POS sales → cycle count → variance investigation. Most shrinkage that turns out to be theft tends to be detectable at the put-away or cycle count step, but only if the upstream data is clean enough to compare.
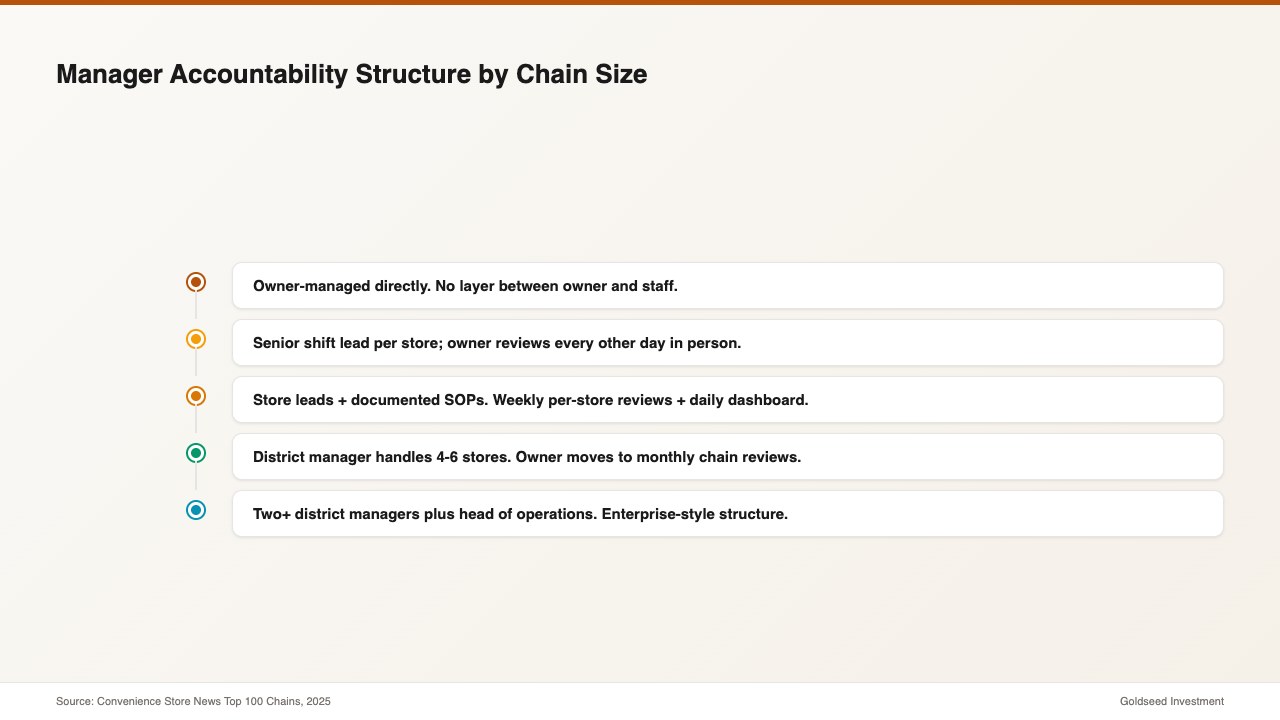
Tip #6 — What’s the Right Manager Accountability Structure for a 3-10 Store Chain?
The accountability structure should change at predictable scaling points. Below is the pattern that tends to hold up across most c-store chains:
1 store: Owner-managed directly. No layer between owner and staff. Owner sets schedule, approves orders, reviews cash daily.
2 stores: Owner is still the primary decision-maker, but a senior shift lead at each store handles routine operations. Owner reviews each store every other day in person.
3-5 stores: A store lead or assistant manager at each location, with documented standard operating procedures. Owner moves to weekly per-store reviews, with daily dashboard scanning. This is the stage where a written manager scorecard — covering cash variance, labor ratio, schedule variance, and customer complaints — becomes essential.
6-10 stores: A district manager layer makes sense. The district manager handles 4-6 stores, reports to the owner, and runs weekly per-store reviews directly. Owner steps back to monthly chain-level reviews focused on financial performance and capital allocation.
10+ stores: Two or more district managers, plus a head of operations. This is the threshold where a multi-location convenience store management framework starts looking more like a small enterprise than an extended single-store operation.
The mistake operators usually make is hiring a district manager too early — at 3 or 4 stores — before the systems exist for the role to actually work. A district manager without standardized SKU lists, shared dashboards, and documented procedures often creates more chaos than they resolve. Build the systems first, then add the layer.
For owners thinking through the transition from single-store to multi-store management, the practical guide to managing two retail stores at once covers the operational shift that happens at the second location.
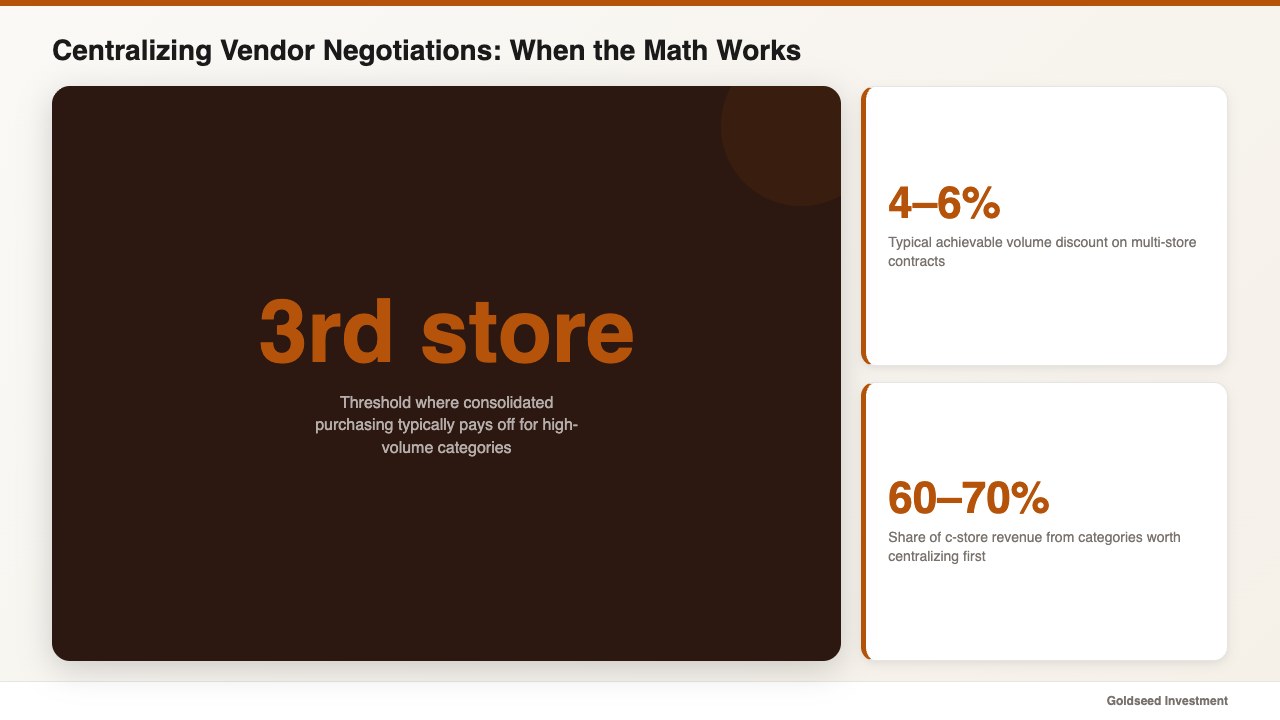
Tip #7 — When Should You Centralize Vendor Negotiations?
Vendor consolidation usually pays off starting at the third store, but only for high-volume categories. Below that, the negotiation overhead tends to outweigh the price advantage. Above that, the pricing leverage compounds quickly.
Categories worth centralizing first: beverages, tobacco, packaged snacks, dairy, and any private-label or proprietary items. These usually account for 60–70% of c-store revenue and have meaningful price flexibility based on volume commitments.
Categories often worth keeping store-level: prepared food (where local supplier relationships matter), seasonal regional items, and any local promotional inventory. Generally, the rule of thumb is centralize where volume pricing matters, decentralize where freshness and local relevance matter more.
Run the math before negotiating. Pull your last 12 months of purchasing data by category. If beverage spend across all stores totals $480,000 and you’re paying the same per-unit price as a single-store operator, a 4–6% volume discount on a multi-store contract is usually achievable — that’s roughly $19,000–$29,000 in annual margin recovery, with very little operational change.
A useful metric to monitor as you centralize: vendor invoice variance. The percentage of vendor invoices that don’t match your purchase order tends to drop when you consolidate suppliers, because each vendor handles fewer order types per location.
Common Mistakes Multi-Store Operators Make
A few patterns tend to undo otherwise sound chains:
Hiring before systemizing. Adding people to manage chaos usually produces more expensive chaos. Document procedures, then hire to follow them.
Treating each store as independent. When stores share no data, no SKU governance, and no policies, you don’t have a chain — you have multiple small businesses with the same owner. This rarely outperforms operating each store separately.
Reviewing data only monthly. A 30-day feedback loop is too slow for c-store margins. Daily dashboards with exception-based alerts catch problems while they’re still small.
Ignoring labor leakage. Schedule variance and unauthorized overtime usually compound into 2–3 percentage points of margin loss per year. Most owners don’t track it because it never appears as a single line-item shock.
Failing to plan succession. A chain that depends on the owner being personally available for any decision is structurally fragile. The point of c-store chain management best practices is to make the operation work whether the owner is in the store, on vacation, or buying the next location.
FAQ
Q: At what number of stores do I need a district manager? A: A district manager generally makes sense at 6+ stores, though some operators add the role at 5 if their stores are geographically dispersed. Below 5, the cost of the position usually outweighs the operational benefit, and the owner can typically still manage direct relationships with each store lead.
Q: How much labor cost ratio should a c-store chain target? A: Convenience store benchmarks suggest 8–14% of revenue, with most well-run chains landing at 10–12%. Stores running above 14% usually have either a scheduling discipline issue or an overstaffing pattern in slow shifts. The retail store profitability analysis guide breaks down how labor cost ratio interacts with the other margin layers.
Q: What’s the most common reason c-store chains fail to scale beyond 5 stores? A: The owner becomes the bottleneck. Decisions that need to happen daily — inventory approvals, schedule changes, cash variance follow-up — funnel through one person who is no longer physically able to be present at every store. Operators who get past 5 stores have usually invested in systems and a manager layer that lets routine decisions happen without owner involvement.
Q: How often should I do physical inventory counts in a multi-store chain? A: Most successful chains run weekly cycle counts on rotating categories rather than full annual inventories. This catches shrinkage and ordering issues within 30 days instead of 12 months. A full physical inventory once or twice a year still tends to be useful for accounting reconciliation, but it’s no longer the primary detection tool.
Q: Should each store have its own bank account? A: Most multi-store operators run a single operating account with store-level reporting tracked through the POS and accounting system. Separate accounts add overhead without operational benefit, and they make cash flow analysis harder. The exception is if you have outside investors or partners with claims tied to specific locations.