Most small retail store owners know they should be reviewing their financials every month. Most don’t. When asked why, the answer typically comes back the same: no accountant, no idea where to start.
David Osei owns a two-location gift shop in Atlanta. For the first four years, he ran the business by checking his bank balance every morning and hoping the number was going up. In early 2024, a bank manager told him his loan application was denied because he couldn’t produce a basic income statement. Within 90 days of building his first financial reporting system, he had an approved line of credit and a clear picture of which location was profitable and which wasn’t.
Rachel Torres manages a small clothing boutique and noticed she was profitable on paper every month but always seemed to be short on cash near the end of the quarter. Creating a cash flow statement revealed the answer immediately: she was paying suppliers 30 days before her peak selling season, creating a predictable cash crunch she’d never formally tracked.
Creating retail financial statements without an accountant is a learnable process — not an advanced skill. This guide walks through each statement step by step, including a retail income statement DIY approach, balance sheet construction, and cash flow tracking.
Can You Create Retail Financial Statements Without an Accountant?
Yes — with two important prerequisites. Retailers can absolutely handle their own financial reporting, and accounting software has made the mechanical process dramatically more accessible over the last decade. According to SCORE’s small business financial literacy resources, store owners who maintain organized records throughout the year can generate all three core statements with minimal outside help.
The statements are only as accurate as the underlying data, however. If you’ve been recording every sale, every expense, and every inventory movement consistently throughout the month, your auto-generated statements will be reliable. If records are inconsistent or personal and business accounts are mixed, the statements will reflect those gaps.
Two non-negotiable foundations: a dedicated business bank account, separate from personal accounts, and consistent recording of every transaction as it happens rather than in a monthly catch-up session. Everything else builds from those two basics.
The retail P&L statement guide below assumes these foundations are in place.
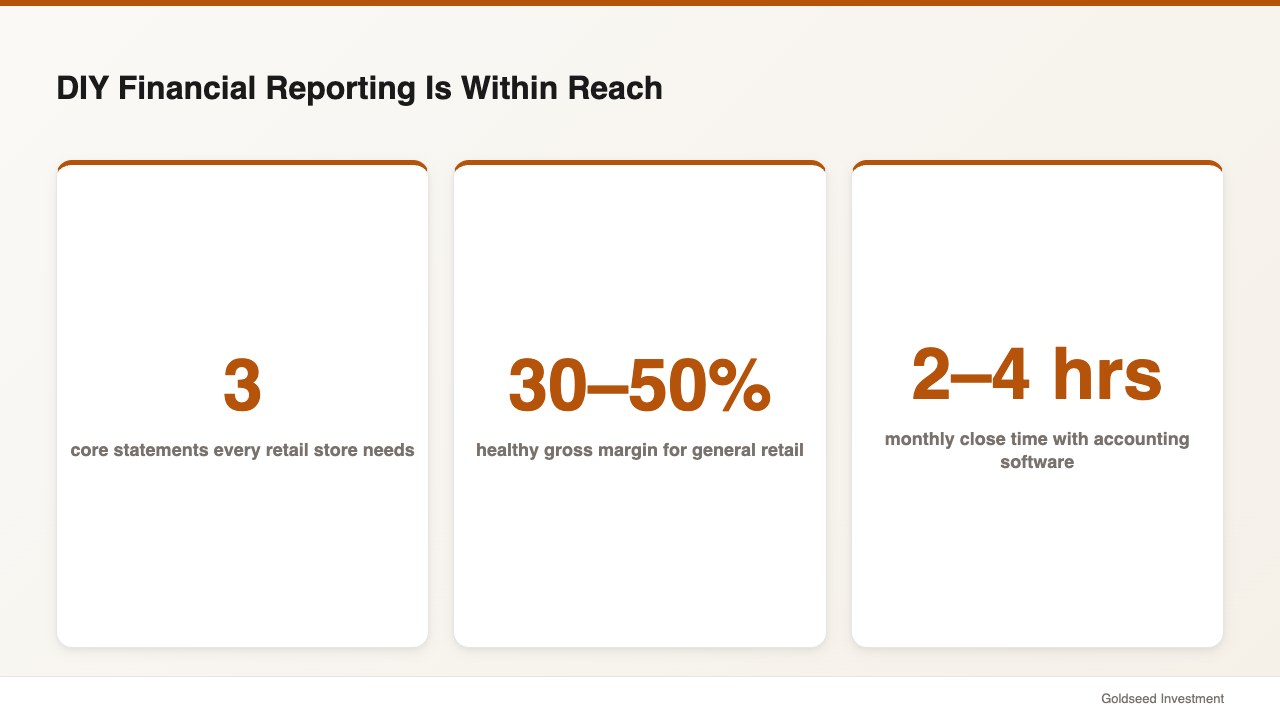
The Three Financial Statements Every Retail Store Needs
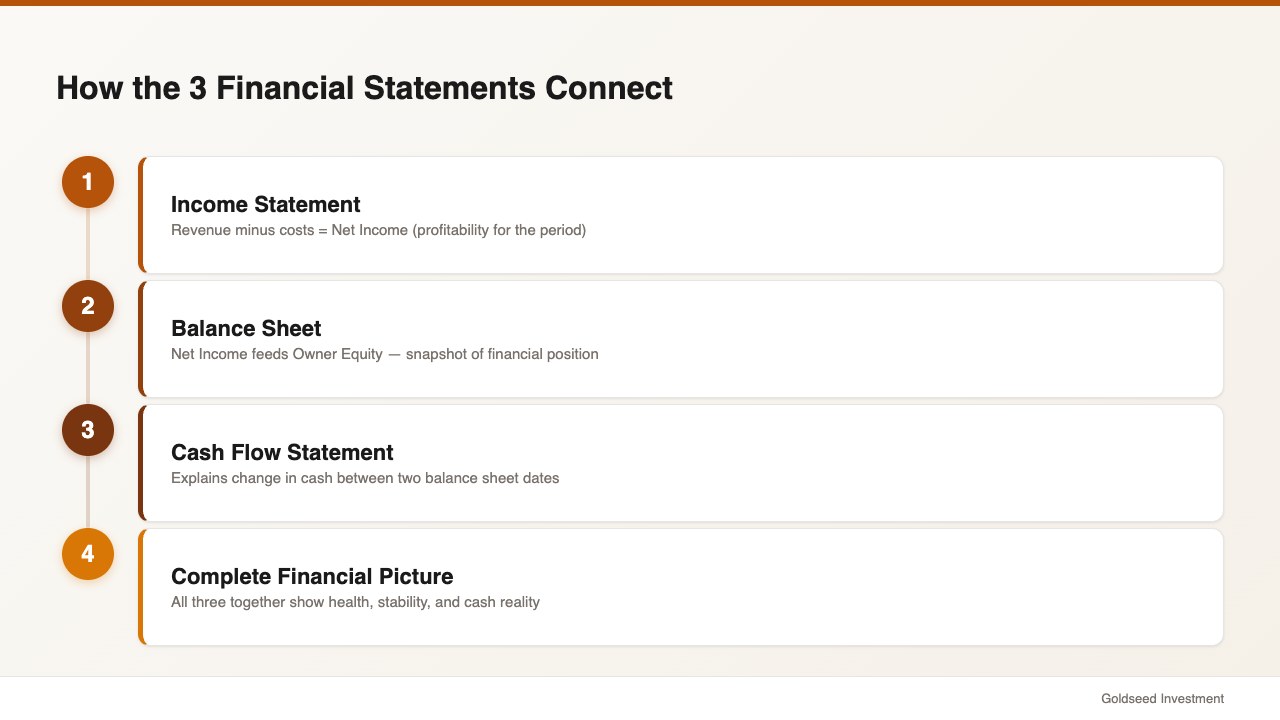
Three financial statements together provide a complete picture of your store’s financial health. Understanding how they connect is more important than understanding every accounting detail — they’re a system, and each one answers a different question.
The Income Statement (Profit & Loss / P&L) answers: “Did my store make money during this period?” It shows revenue, cost of goods sold, gross profit, operating expenses, and net income for a specific period — typically monthly. Your retail P&L statement is the most frequently reviewed document in day-to-day operations and typically the best starting point for first-time DIY financial reporting.
The Balance Sheet answers: “What does my store own and owe right now?” Unlike the income statement, which covers a period, the balance sheet is a snapshot taken on a specific date. Assets must equal Liabilities plus Owner’s Equity — this equation always holds. The balance sheet tells you whether your business is financially stable beyond just its profitability.
The Cash Flow Statement answers: “Where did the cash go?” A store can show a healthy net income on its income statement while running out of cash — a situation that surprises many retail owners. The cash flow statement bridges this gap by showing the timing of actual cash movements. According to Bench Accounting’s 2025 guide to cash flow statements, understanding operating cash flow is often more important for day-to-day survival than understanding net income.
These three statements work together: net income from the income statement feeds into the equity section of the balance sheet, and the cash flow statement explains the change in your cash balance between two balance sheet dates. For retail and convenience store owners who want to see the P&L format in detail, see for our convenience store P&L benchmark guide.
How to Create a Retail Income Statement (P&L)
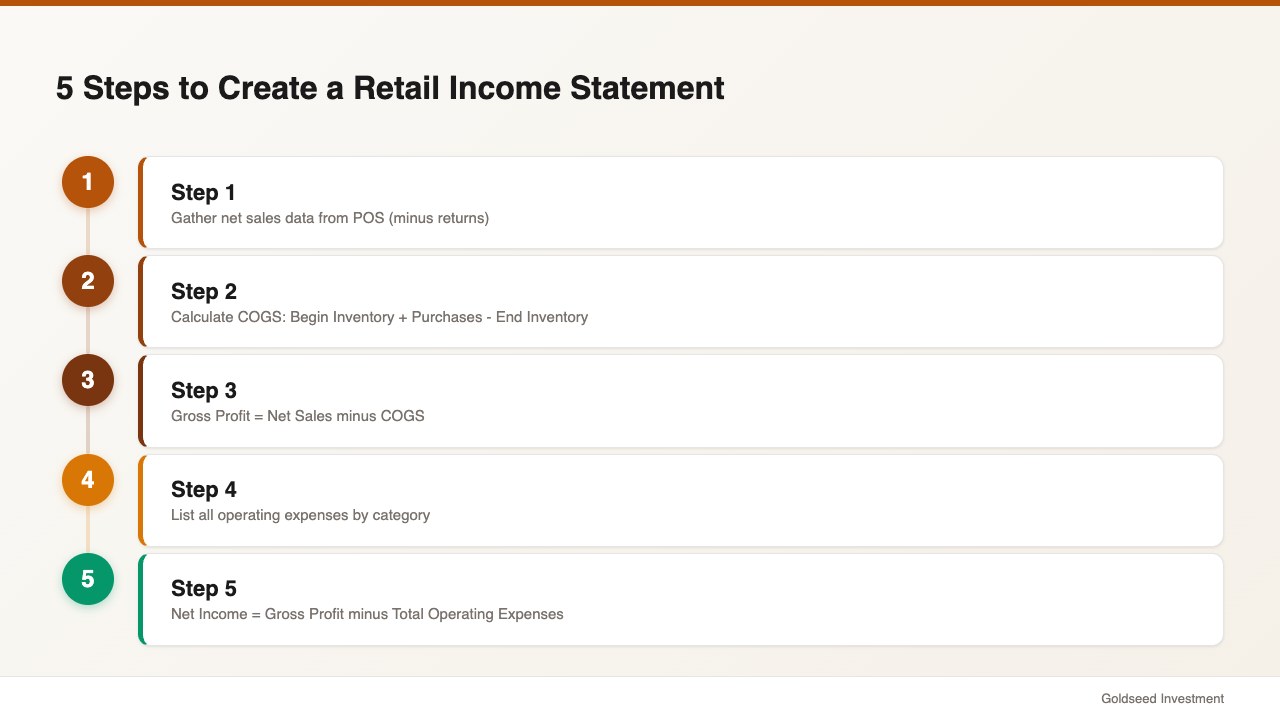
The retail income statement DIY process starts with gathering the right inputs, then organizing them into the standard P&L structure. Here’s the step-by-step approach.
Step 1: Gather your revenue data. Total revenue (net sales) is the starting line of your income statement. Pull this from your POS system: total sales for the period, minus returns and refunds. If you have multiple revenue streams — in-store sales, online orders, service fees — list each separately and sum them into a Total Net Revenue line.
Step 2: Calculate Cost of Goods Sold (COGS). COGS is what you paid for the products you actually sold during the period — not everything you bought, only what sold. The formula: Beginning Inventory + Purchases During Period − Ending Inventory = COGS. This calculation requires knowing your inventory value at both the start and end of the period. Your POS system’s inventory module, or a regular physical count tracked in a spreadsheet, provides the needed figures.
Step 3: Calculate Gross Profit. Gross Profit = Net Revenue − COGS. This is the margin your store earns after paying for merchandise but before covering operating costs. According to Retail Dogma’s retail financial statements guide, a healthy gross margin for general merchandise retail typically runs 30 to 50%. Margins consistently below 25% generally indicate pricing, product mix, or COGS problems worth investigating.
Step 4: List your operating expenses. Operating expenses cover everything it costs to run the store beyond merchandise: rent, utilities, payroll (wages and benefits), marketing, insurance, depreciation, supplies, and so on. Group them into meaningful categories and list each separately. Most small retail stores have 8 to 15 expense line items. Being granular here is more useful than being compressed — you want to be able to see which expense categories are growing or out of range.
Step 5: Calculate Net Income. Net Income = Gross Profit − Total Operating Expenses. This is your bottom line for the period. Positive net income means profitability. Negative net income means operating at a loss. Net income flows directly into your balance sheet as a component of owner’s equity.
Sample retail income statement (monthly):
| Line Item | Amount |
|---|---|
| Net Sales | $42,000 |
| Cost of Goods Sold | $24,000 |
| Gross Profit | $18,000 |
| Rent | $4,200 |
| Payroll | $7,500 |
| Utilities | $800 |
| Marketing | $600 |
| Other Expenses | $900 |
| Total Operating Expenses | $14,000 |
| Net Income | $4,000 |
Source: Illustrative example based on retail P&L benchmarks from Retail Dogma (2025)
Gross margin in this example: 42.9% ($18,000 ÷ $42,000). Net margin: 9.5% ($4,000 ÷ $42,000). Both fall within typical ranges for a general merchandise retail store.
How to Build a Retail Balance Sheet Without an Accountant
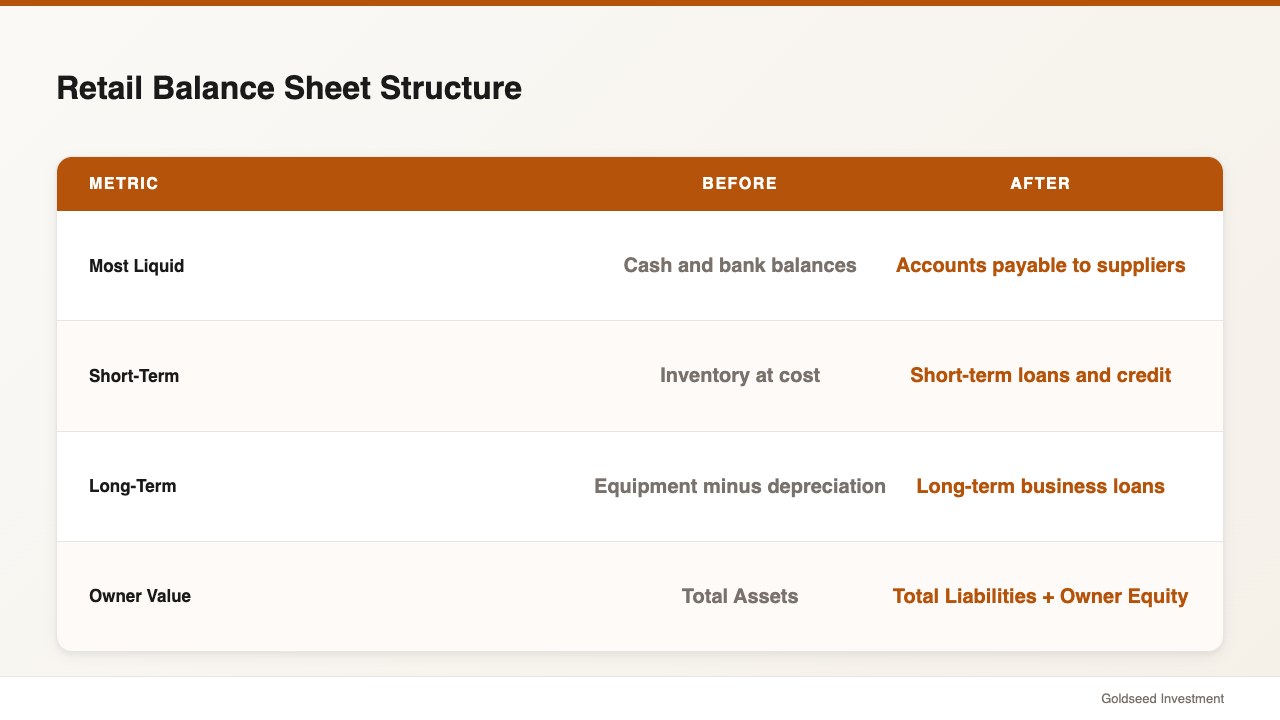
The retail balance sheet without accountant approach is slightly more involved than the income statement because it accumulates history — it’s a running total of everything your business has ever owned, owed, and earned, as of a specific date.
Assets (what you own): List assets in order of liquidity — how quickly they can be converted to cash. Current assets appear first: cash and bank balances, accounts receivable (money owed to you by wholesale buyers, if applicable), and inventory at cost. Fixed assets follow: equipment, furniture, fixtures, and leasehold improvements listed at purchase cost minus accumulated depreciation.
Liabilities (what you owe): Current liabilities are obligations due within 12 months: accounts payable (money owed to suppliers), short-term loans, credit card balances, and sales tax payable. Long-term liabilities include business loans and lease obligations due beyond 12 months.
Owner’s Equity: Owner’s Equity = Total Assets − Total Liabilities. For a sole proprietor or single-member LLC, this section typically includes the original invested capital plus or minus all net income (or losses) since founding, minus any owner draws. The balance sheet must balance — Total Assets must equal Total Liabilities plus Total Equity. When it doesn’t, a transaction is recorded on one side but not the other.
According to NetSuite’s explanation of retail financial statements (2025), the most common balance sheet error for DIY retail bookkeepers is inventory valuation — the COGS formula used in the income statement must be perfectly consistent with ending inventory recorded on the balance sheet.
For a structured template and walkthrough specifically designed for retail, see — our retail store balance sheet template guide.
How to Create a Cash Flow Statement for Your Store
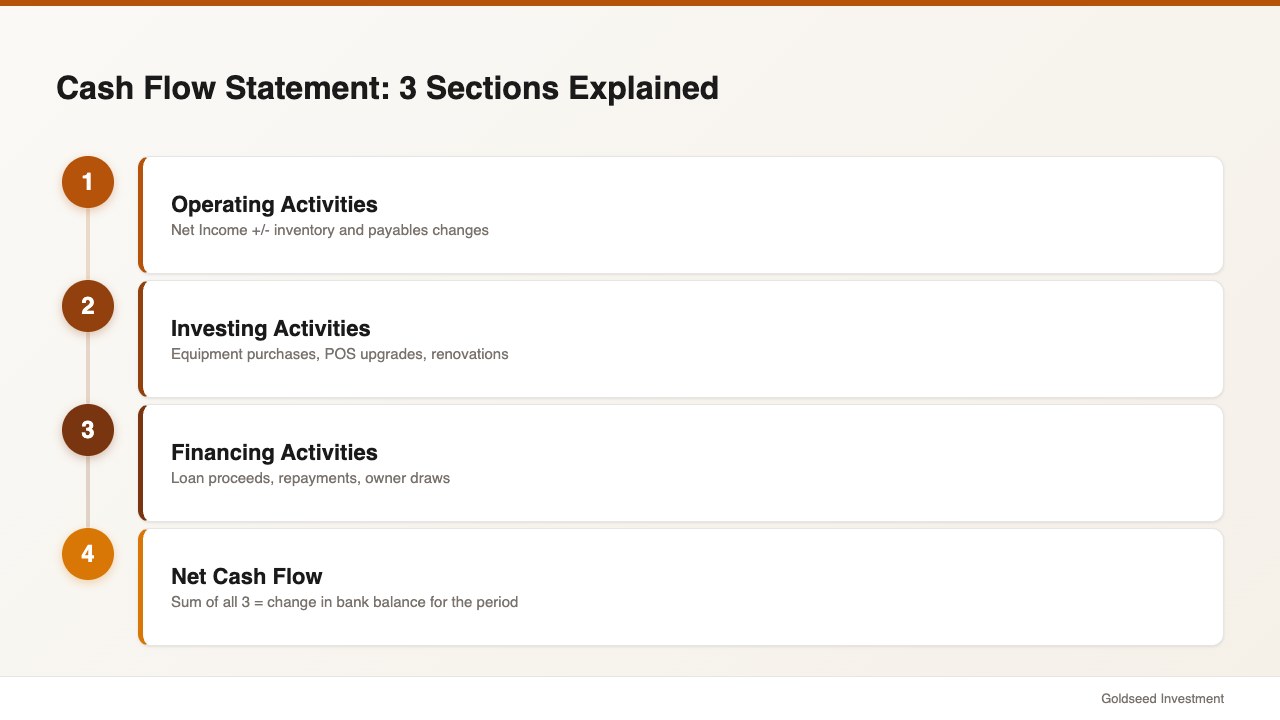
The cash flow statement is the most misunderstood of the three statements — and for retail store owners managing tight cash cycles, it may be the most operationally important one.
The statement organizes cash flows into three sections:
Operating Activities covers cash flows from your core business. Start with net income from your income statement, then adjust for non-cash items and working capital changes. For retail, the key adjustments are typically inventory changes (buying inventory is a cash outflow even before you sell it) and changes in accounts payable (paying suppliers later keeps cash in the business longer). This is often where the gap between “profitable on paper” and “short on cash” becomes visible.
Investing Activities captures cash used to buy or sell long-term assets: equipment purchases, POS system upgrades, store renovation costs, and so on. For most small retail stores, this section is straightforward — it reflects capital spending during the period.
Financing Activities covers cash flows related to borrowing and repayment. Loan proceeds are inflows; loan repayments and owner draws are outflows.
The net total of all three sections equals the change in your cash balance for the period. If beginning cash was $8,000 and net cash flow was +$2,500, ending cash should be $10,500. Verify this against your bank statement. When it doesn’t match, a transaction is miscategorized or missing.
Accounting software that connects to your bank account through automated bank feeds can generate the cash flow statement with reasonable accuracy automatically. Reconciling it monthly against your bank statement catches the transactions that fall through the cracks.
Your Monthly Financial Close Checklist
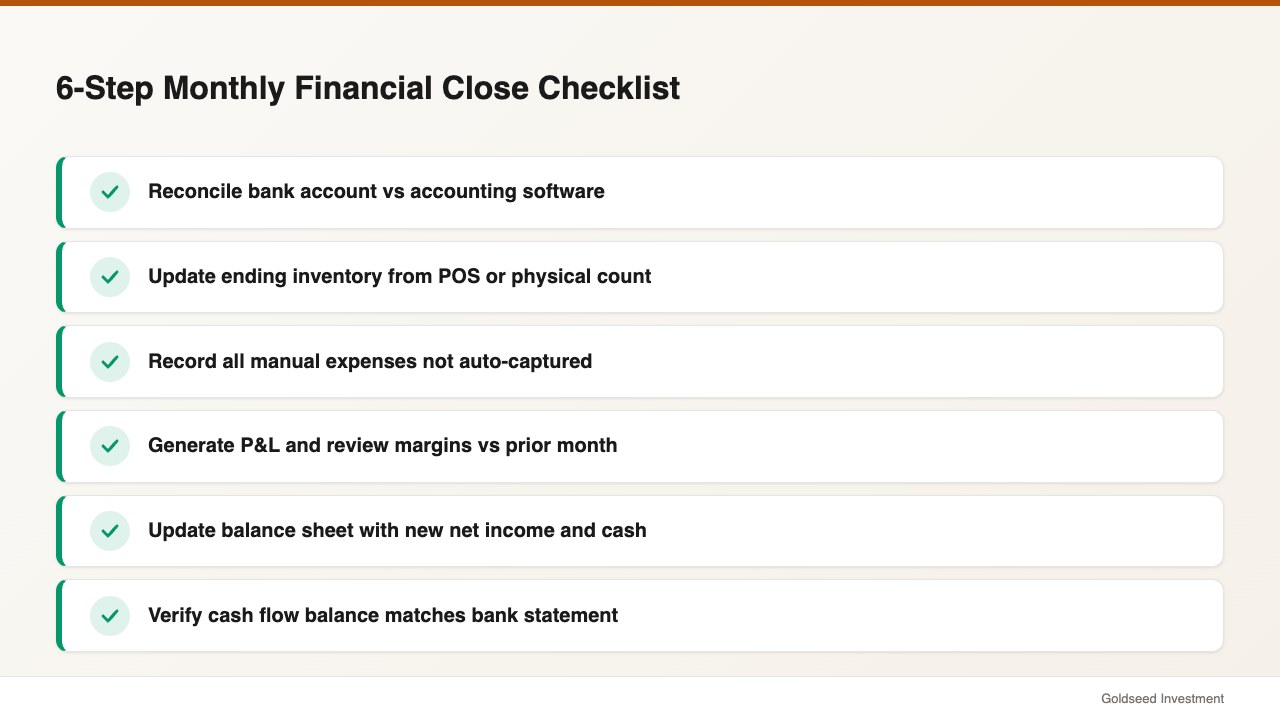
Consistency matters more than sophistication. A store running a basic monthly close every month will have far better financial visibility than one attempting comprehensive reporting twice a year. Here’s a practical 6-step monthly close process.
Week 1 after month-end — Bank reconciliation: Match every transaction in your bank statement against your accounting system. Flag discrepancies immediately; unresolved differences compound quickly.
Week 1 after month-end — Inventory update: Confirm ending inventory value using your POS inventory report or physical count. This directly feeds your COGS calculation and flows into both the income statement and balance sheet.
Week 1 after month-end — Expense recording: Ensure any expenses not automatically captured are recorded — manual supplier payments, cash purchases, owner-paid business expenses.
Week 2 after month-end — Income statement generation: Generate your P&L for the closed month. Review gross margin against prior month and prior year. Flag any expense line that moved more than 15%.
Week 2 after month-end — Balance sheet update: Update with the new net income, current cash balance, and current inventory value. Confirm the balance equation holds.
Week 2 after month-end — Cash flow review: Generate or review the cash flow statement. Confirm ending cash reconciles to your bank balance.
Total time for a well-organized store using accounting software: typically 2 to 4 hours per month. For a store using manual spreadsheets: usually 4 to 8 hours. Either approach represents among the highest-return financial time a store owner can invest.
Tools That Make DIY Financial Statements Easier
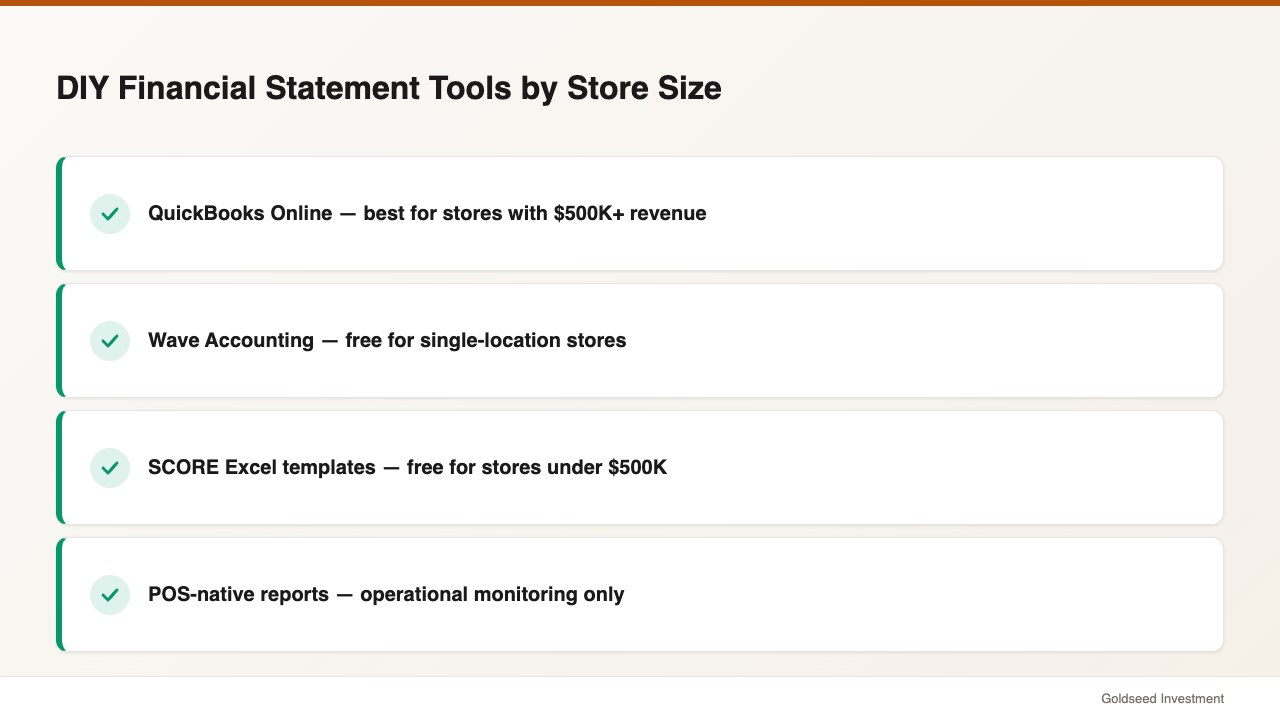
QuickBooks Online remains the most widely used small business accounting software in 2026. Bank feeds, automatic transaction import, and one-click financial statement generation make it practical for stores with moderate complexity. Pricing starts around $30/month. It has the most retail POS integrations available.
Wave Accounting (wave.com) is a free double-entry accounting tool with bank connections and auto-generated financial statements. Less depth on inventory and POS integration compared to QuickBooks, but well-suited for single-location stores with straightforward inventory.
SCORE’s free spreadsheet templates (score.org) offer Excel-based income statement, balance sheet, and cash flow statement templates requiring manual data entry. Appropriate for stores doing under $500K in annual revenue who want direct control over every number.
POS-native reporting: Square, Clover, and Shopify POS all include financial reporting modules that generate simplified income statements directly from sales data. These may not be GAAP-compliant, but they’re useful for operational monitoring between formal reporting periods.
When You Actually Do Need an Accountant
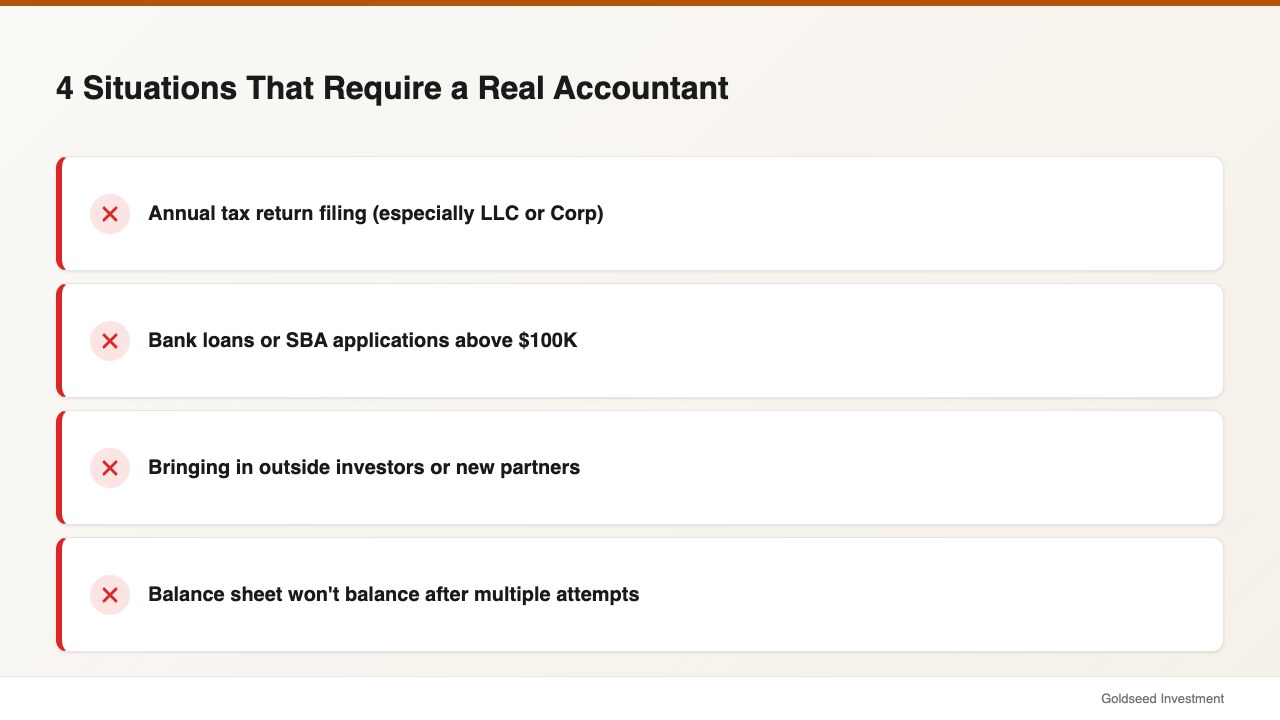
DIY financial statements have real limits. Several situations create more risk when attempted alone.
Tax filing involves elections, depreciation schedules, and deduction rules that change year to year. Most retail owners benefit from at least a tax preparer review for their annual return, even with solid year-round bookkeeping.
Bank loans and SBA applications above $100,000 typically require CPA-prepared or CPA-reviewed financial statements. Lenders reviewing self-prepared statements have no independent verification. If you’re planning to apply for financing, begin working with an accountant 6 to 12 months in advance.
Outside investors or partners will generally require audited or independently reviewed financials. This is a standard requirement, not a preference.
Persistent balance sheet imbalance or COGS discrepancies — if your balance sheet consistently won’t balance or your income statement margins seem wrong despite multiple attempts, an accountant can identify the classification error driving the problem in an hour.
The right approach for most small retail owners: DIY financial reporting for monthly monitoring, accountant for annual tax filing and any situation involving third-party financial review. This arrangement typically costs $1,000 to $3,000 per year rather than $5,000 to $10,000 for full-service monthly accounting.
Frequently Asked Questions
How often should a small retail store owner review financial statements?
Monthly at minimum — and income statement review should happen weekly for stores managing tight margins or cash flow. Once your accounting system is set up, the income statement can take 10 minutes to review after it’s auto-generated. Balance sheets warrant a thorough monthly review. Cash flow should be checked whenever your cash position doesn’t seem to match your profitability.
What’s the difference between a retail income statement and a P&L?
They’re the same document. “Profit and Loss statement” and “Income Statement” both refer to the summary of revenue, costs, and net income over a defined period. Some accounting software labels it “P&L,” others say “Income Statement.” Structure and content are identical — only the label differs.
Can I use my POS system reports as a substitute for financial statements?
POS reports give you sales data but aren’t complete financial statements. They typically show gross revenue and sometimes COGS, but don’t include operating expenses, liabilities, owner equity, or cash flow. Use your POS report as an input to your income statement, not as a replacement for it. The income statement tells you whether the business is profitable; the balance sheet tells you whether it’s financially stable; the cash flow tells you where the money actually went.
Sources: SCORE — Understanding Financial Statements | Retail Dogma — Retail Financial Statements | NetSuite — Retail Financial Statements Explained (2025) | Bench Accounting — Cash Flow Statement Guide 2025 | FreshBooks — Financial Statements Guide