Retailers who run structured stock counts at least quarterly catch inventory discrepancies 34% more often — and close them before shrinkage eats into margin.
When Maria ran her quarterly stock count last October, the tally came back eight units short on her top-selling product line. Her POS showed 52 units on hand. The shelf held 44. She had no way to know if those missing eight were stolen, miscounted during the last receiving shipment, or simply entered wrong into the system. The answer mattered — but the process to find it had taken her team the better part of a Sunday afternoon, and the root cause was still unclear by the time the store opened Monday morning.
That experience isn’t unusual. Most retail stock counts fail not because the products aren’t there, but because the counting process itself is poorly organized. This guide covers how to run a retail stock count efficiently — from preparation through reconciliation — so you spend less time counting and more time acting on what the numbers tell you.
What Is a Retail Stock Count — and Why Does It Matter?
A retail stock count (also called a physical inventory count) is the process of manually verifying how many units of each product you actually have on hand, then comparing that figure to what your records say you should have. The gap between those two numbers is your inventory discrepancy — and tracking it consistently is one of the clearest signals of operational health in any retail store.
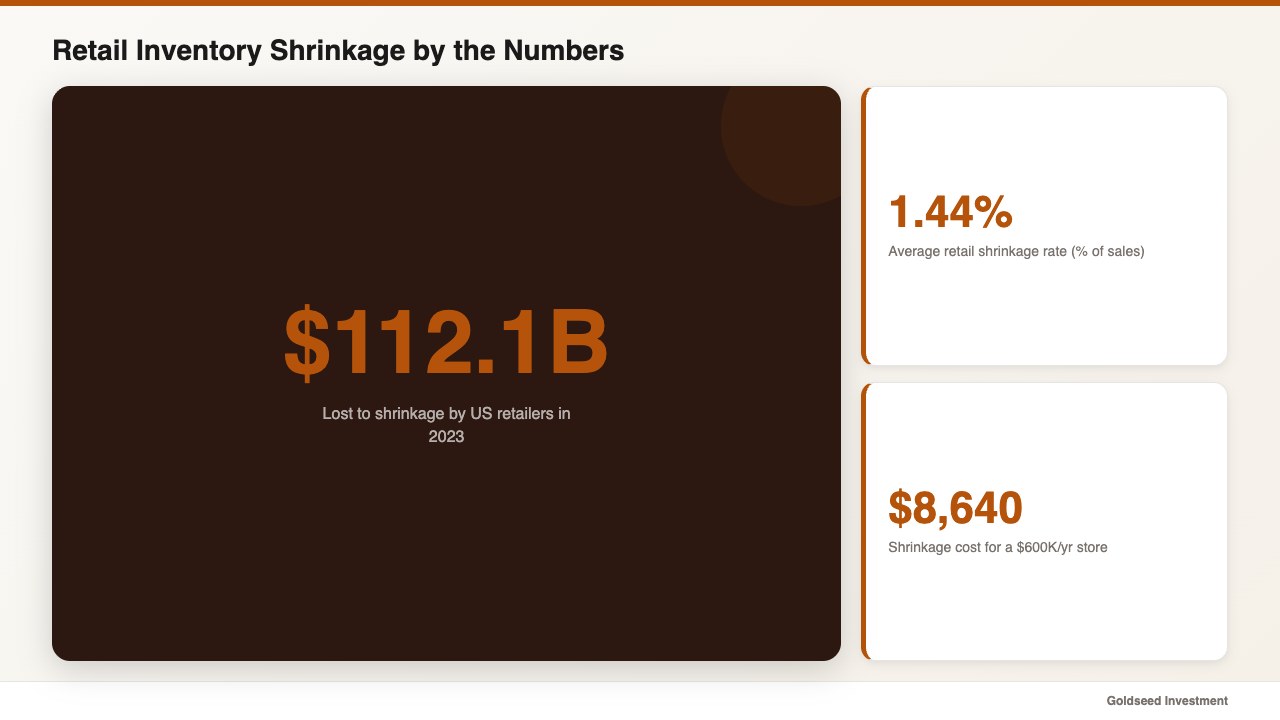
According to the National Retail Federation’s 2024 Security Survey, U.S. retailers lost $112.1 billion to inventory shrinkage in 2023, with an average shrinkage rate of 1.44% of total sales. For a store doing $600,000 a year in revenue, that’s roughly $8,640 gone — often invisible until count day.
Stock counts matter for three interconnected reasons. First, they validate your on-hand data so purchasing decisions are based on reality rather than system assumptions. Second, they identify shrinkage before it compounds. Third, they reveal receiving errors and vendor discrepancies that would otherwise go undetected for months.
One retail operator described the moment she took counting seriously: “Before, when numbers didn’t match, I had no way to know if it was theft, a counting error, or a receiving mistake. I couldn’t act on any of it because I couldn’t identify the cause.”
How Does a Retail Stock Count Actually Work?
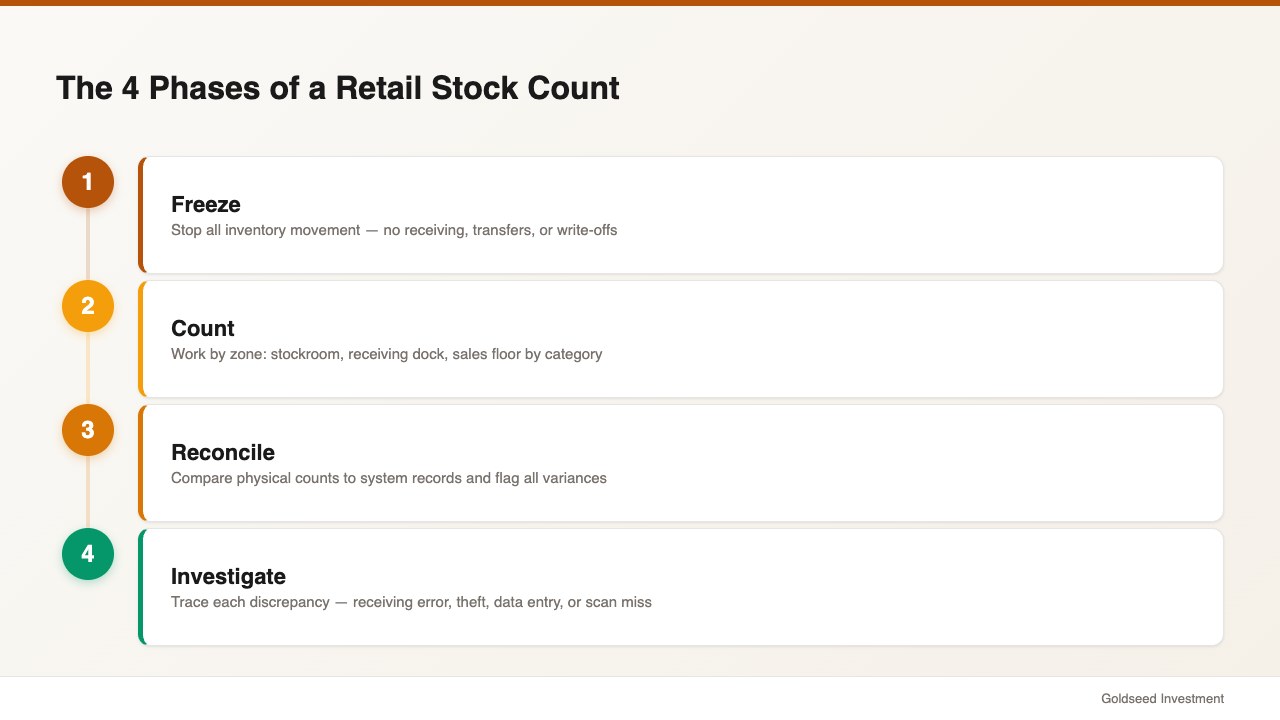
At its core, a stock count follows four phases: freeze, count, reconcile, and investigate. Each phase has a distinct purpose, and skipping any one of them tends to corrupt the results of the others.
Freeze means stopping all inventory movement — no receiving, no transfers, no write-offs — during the count window. Even a single unrecorded delivery during an active count can throw an entire zone off.
Count is the physical act of counting every SKU in a defined location. Efficient teams work by zone (receiving area, stockroom, sales floor by category) rather than trying to move through the store at random.
Reconcile is where you compare physical counts to system records and flag every variance. Variances above a set threshold (many retailers use ±2 units or ±$20 cost value) get escalated for investigation.
Investigate means tracing the source of each flagged discrepancy. Was it a receiving error? A scan miss during a recent sale? A transfer that wasn’t logged? The investigation phase is where a count stops being a formality and starts being a management tool.
Tools used in a typical count include printed count sheets organized by zone and SKU, handheld barcode scanners, or mobile inventory apps that allow direct digital entry. Paper remains common in small stores but introduces transcription errors at the reconciliation stage.
What’s the Most Efficient Method: Full Count vs. Cycle Count?
The two primary formats for retail stock counting are full physical counts and cycle counts. They serve different purposes and suit different store sizes and operational rhythms.
A full physical count covers every SKU in the store at one time, typically requiring a store closure or after-hours session. It gives a complete snapshot but is labor-intensive. Most independent retailers who rely exclusively on full counts do them once or twice a year — which often means shrinkage and discrepancies go undetected for six months at a stretch.
A cycle count is a rolling program where different sections or categories are counted on a rotating schedule — for example, high-velocity items weekly, medium-velocity monthly, slow movers quarterly. According to McKinsey & Company research on retail inventory management, retailers using formal cycle-count programs reduce on-hand inventory errors by up to 34% compared to annual-only programs.
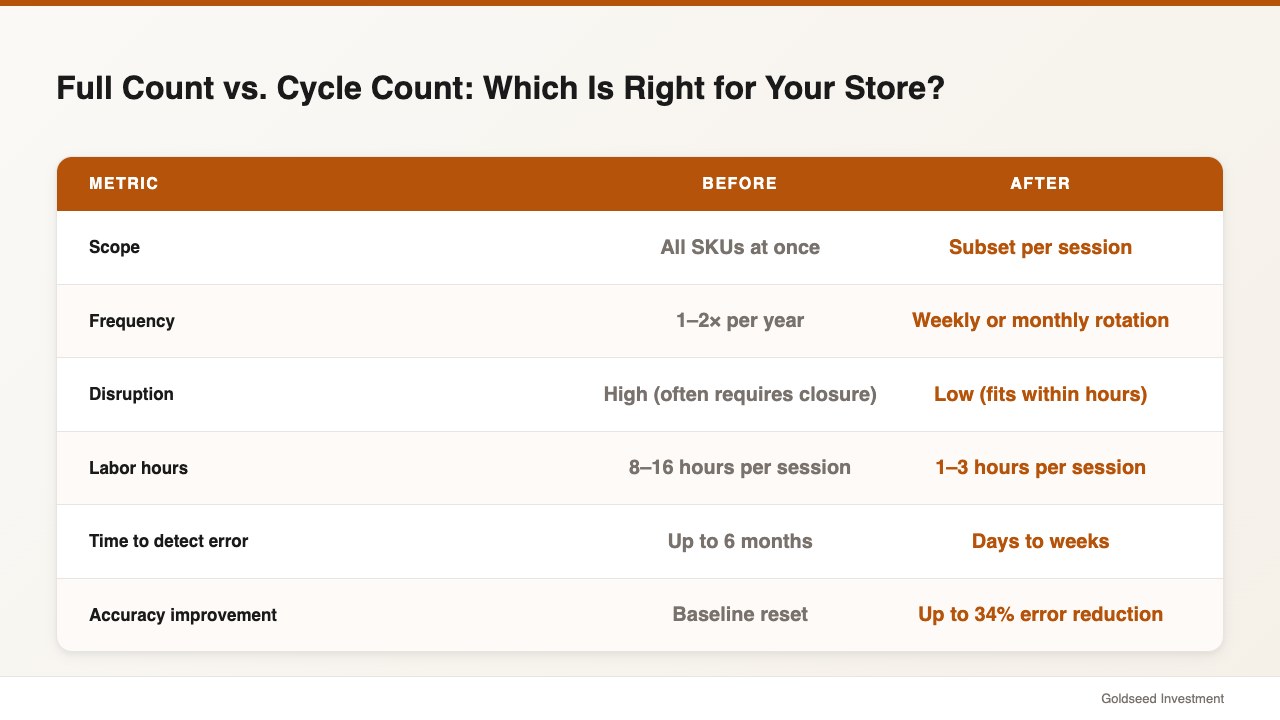
| Factor | Full Physical Count | Cycle Count |
|---|---|---|
| Scope | All SKUs at once | Subset per session |
| Frequency | 1–2× per year | Weekly or monthly rotation |
| Disruption | High (often requires closure) | Low (fits within operating hours) |
| Labor hours per session | 8–16 hours (avg store) | 1–3 hours |
| Time to detect discrepancy | Up to 6 months | Days to weeks |
| Best for | Annual audit baseline | Ongoing accuracy |
| Accuracy improvement | Baseline reset | Up to 34% error reduction |
Source: NRF Retail Security Survey, 2024; McKinsey Retail Inventory Research, 2023
Most store owners who want to do stock counts efficiently end up running a hybrid model: one full count per year to reset the baseline, with cycle counts on high-value or high-shrinkage categories throughout the year.
How Do You Prepare Your Store for a Stock Count?
Preparation is where most inefficient counts lose their time. Stores that walk in underprepared tend to spend 40% of their count session just organizing — rather than counting. Here’s what preparation looks like for a well-run count:
48–72 hours before:
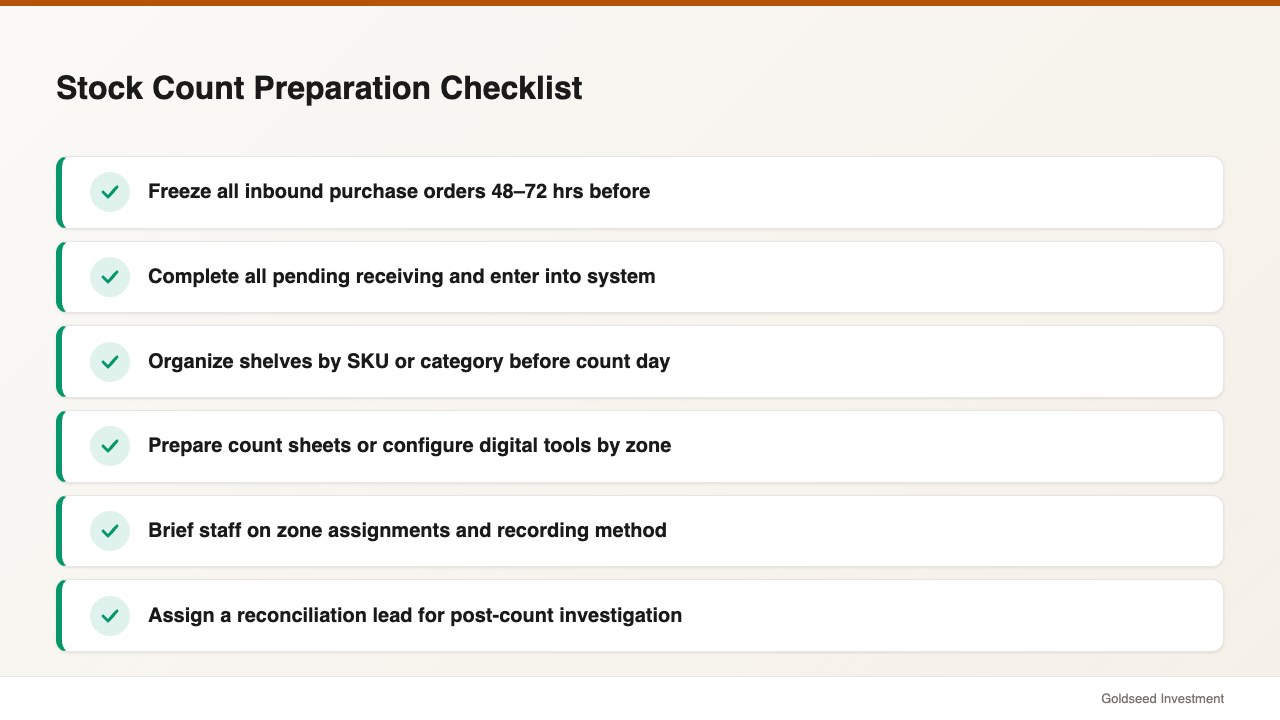
- Freeze all inbound purchase orders and inter-store transfers
- Complete any pending receiving and enter it fully into the system
- Resolve any open discrepancies from the previous count so they don’t carry forward
24 hours before:
- Organize shelf merchandise by SKU or category to make counting faster
- Clean up stockroom areas — loose product mixed with multiple categories is a common source of count errors
- Prepare count sheets or configure digital counting tools by zone
Day of count:
- Brief all participating staff on zone assignments, counting method, and how to handle items with no barcode or damaged labels
- Set a clear freeze time — no sales activity in the zone being counted, or all transactions during the count window must be tracked separately
- Assign a reconciliation lead who will handle variance investigation after physical counting ends
Pull your most recent inventory report before the count begins. This gives your team a reference point and speeds up the reconciliation phase when discrepancies surface. It also helps catch obvious data-entry errors — if your system shows 300 units of a product and your shelf holds 30, that’s a data issue, not a shrinkage event.
Step-by-Step: Running an Efficient Stock Count
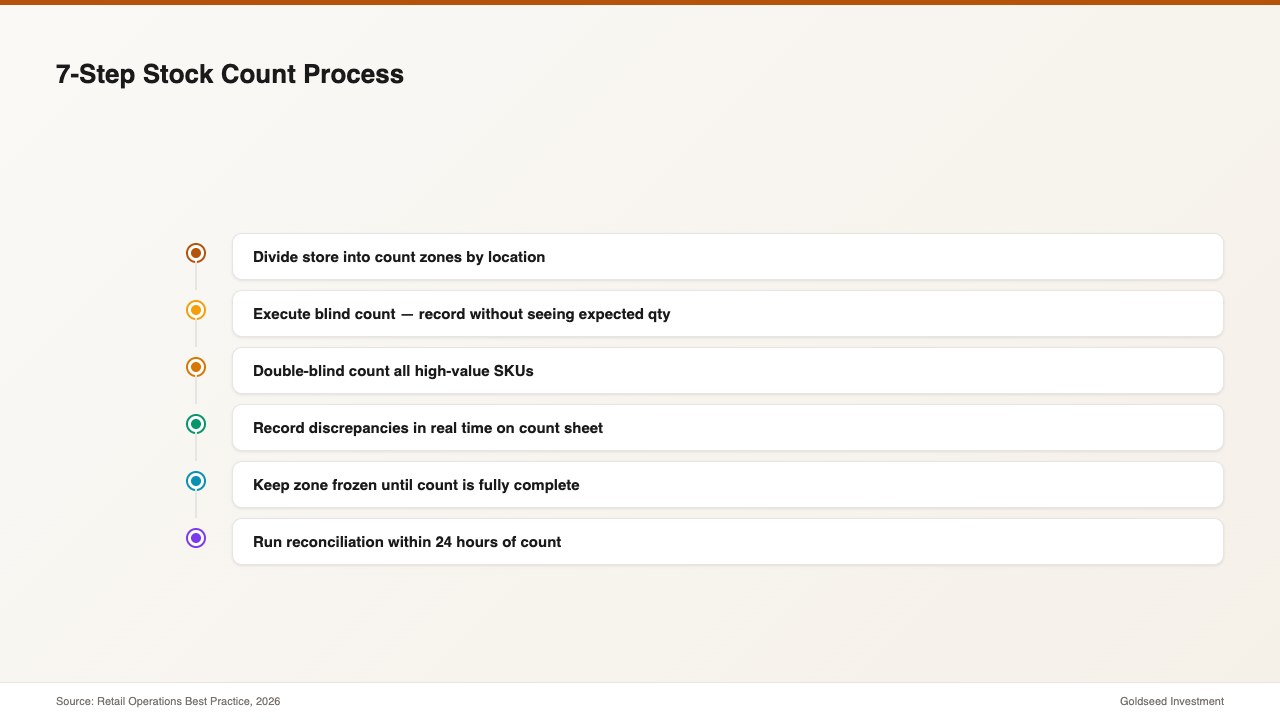
Here’s a practical seven-step process that works for a single-location store with 500–5,000 SKUs:
Step 1 — Divide the store into count zones. Group by physical location: stockroom, receiving dock, sales floor by category. Assign one or two people per zone. Zones that overlap or aren’t clearly defined are the single biggest source of missed items.
Step 2 — Execute a blind count first. Count without looking at the expected quantity. Counting to confirm a number rather than discover one introduces bias and reduces accuracy. Record what you find; compare to system numbers afterward.
Step 3 — Use a double-blind count for high-value SKUs. Have two separate people count the same items independently. If counts match, enter the result. If they differ, a third recount resolves it. This is standard practice for jewelry, electronics, and any SKU where one unit represents significant cost value.
Step 4 — Record discrepancies in real time. Don’t wait until the full count is done to flag variances. Mark them on the count sheet as you go. A real-time log of discrepancies speeds up the investigation phase significantly.
Step 5 — Complete the count before reopening the zone. Even in a cycle count, the zone being counted should be frozen until the count is finalized. Mixing live transactions with an active count creates irreconcilable errors.
Step 6 — Run reconciliation within 24 hours. Compare physical counts to system records by SKU. Flag all variances above your threshold. Group variances by likely cause: receiving, sales, theft, damage, or data entry.
Step 7 — Investigate and close flagged items. For each flagged variance, trace back through transaction logs — receiving records, sales history, inter-store transfer logs. Some discrepancies will resolve immediately (a scan miss, an uncounted backstock bin). Others may require a follow-up count or deeper investigation into convenience store inventory shrinkage rates to benchmark whether your variance pattern is within normal range.
Which Stock Count Metrics Should Every Retail Manager Track?
Running a count is only half the work. Tracking the right metrics from each count turns raw data into a repeatable management system.
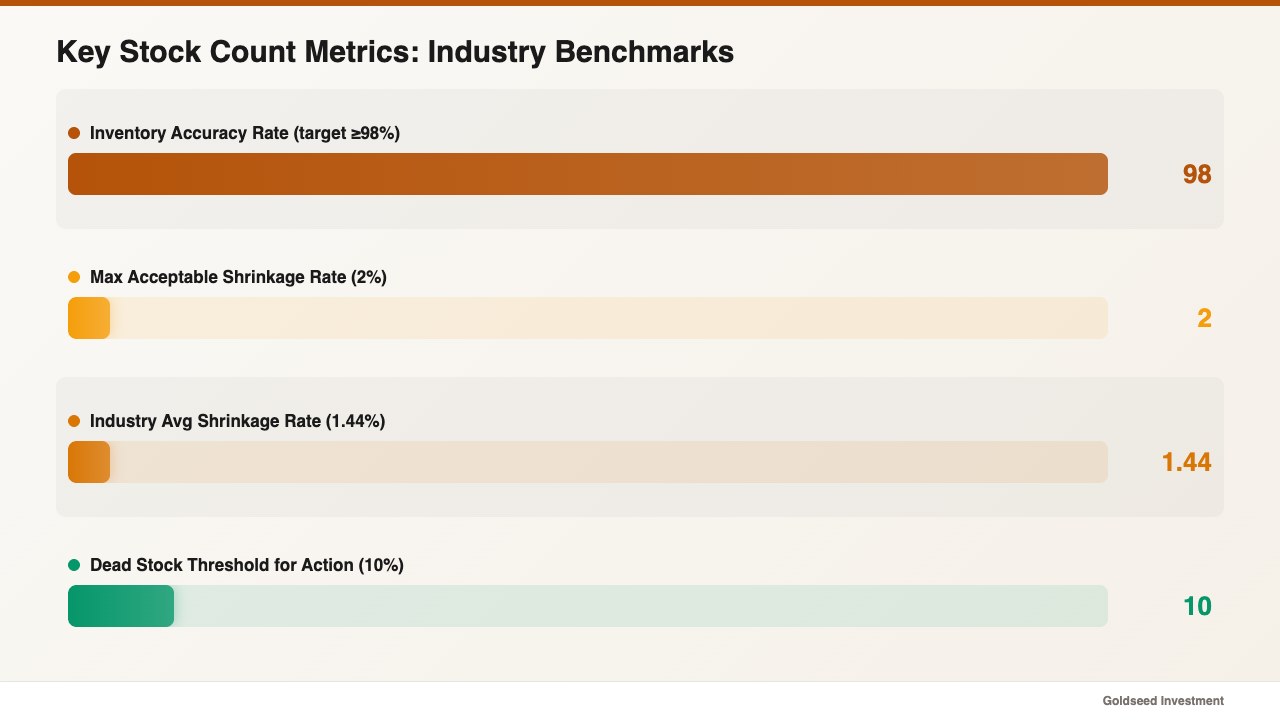
Inventory accuracy rate. Calculated as (matched SKUs ÷ total SKUs counted) × 100. Industry benchmark is ≥98%. Anything below 95% suggests a systemic issue — receiving errors, data-entry problems, or organized theft.
Shrinkage rate. (Book inventory value − Physical inventory value) ÷ Total sales × 100. The NRF average sits at 1.44% for 2024. A store above 2% warrants a more frequent count schedule and a closer look at loss patterns.
Count variance by category. Breaking down discrepancies by product category often reveals patterns — a specific vendor’s shipments that tend to be short, a category with high external theft risk, or a zone where counts are consistently inaccurate due to disorganization.
Dead stock percentage. While running the count, flag items with zero sales in the past 90 days. Dead stock ties up cash at cost value and tends to accumulate in corners where it gets missed in future counts. Calculate your dead stock percentage and set a threshold for markdown or return action.
Time per SKU. Divide total labor hours by total SKUs counted. Tracking this metric over multiple counts shows whether your process is becoming more efficient or stagnating. Most experienced teams target 30–50 SKUs per person per hour in an organized environment.
A structured approach to these metrics also feeds into a broader retail shrinkage audit process, allowing you to compare trends across quarters and catch category-level problems before they grow.
What Mistakes Make a Retail Stock Count Take Twice as Long?
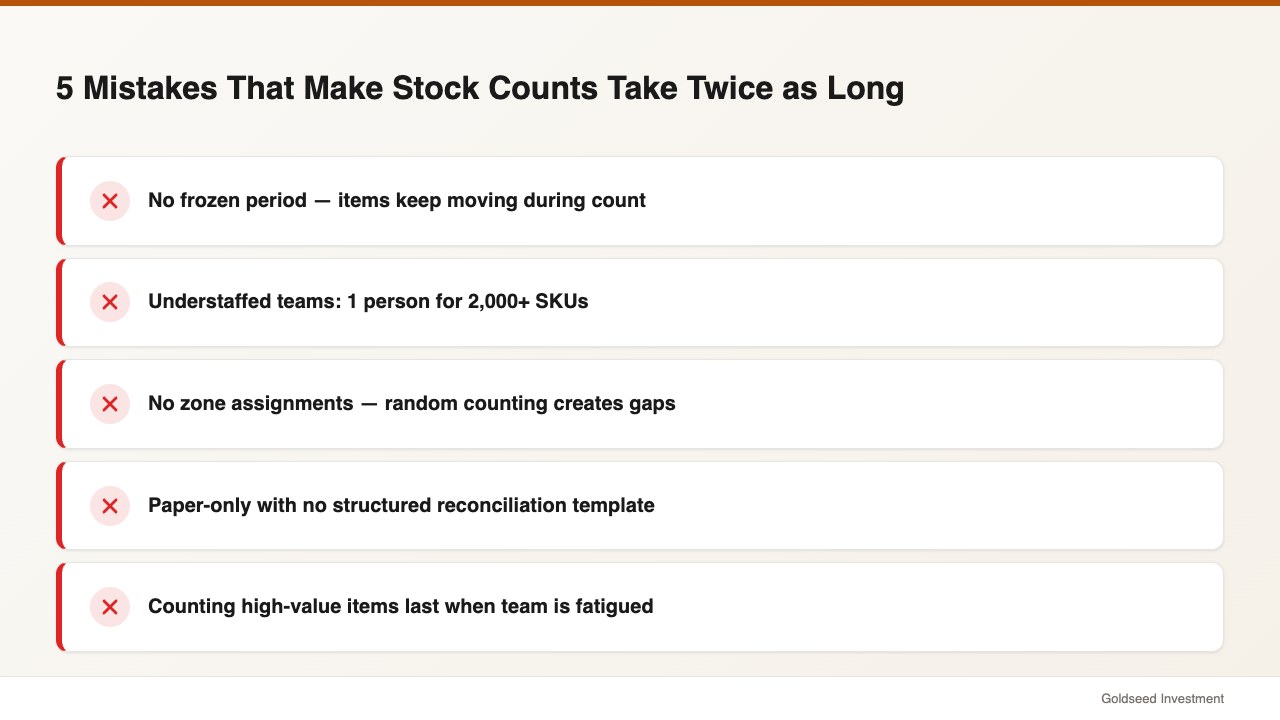
Most of the time lost in a stock count comes from a small set of avoidable errors:
No frozen period. Counting while items are still moving — sales transactions processed, deliveries received — creates a moving target. By the time you reconcile, the system numbers have changed and your count is already outdated.
Understaffed count teams. A single person counting a stockroom with 2,000 SKUs will take 6–8 hours. The same job with four people working assigned zones takes under 2 hours. Labor is the primary driver of count efficiency; cutting people to save cost usually costs more in lost productivity.
No zone assignment. Random counting — whoever is available just starts somewhere — leads to items being counted twice in some areas and missed entirely in others. Zone maps, even basic hand-drawn ones, reduce this problem significantly.
Paper-only processes without a reconciliation template. Transferring hand-counted numbers to a spreadsheet for reconciliation introduces transcription errors. Teams that use structured count sheets with pre-populated SKUs and expected quantities close out their counts faster and with fewer entry mistakes.
Counting everything in the wrong order. Count high-value, high-shrinkage items first — when the team is fresh and focused. Counting them last, at the end of a four-hour session, in many cases produces the least accurate results of the entire count.
A well-designed retail inventory accountability tracking system can significantly reduce time spent on manual reconciliation by automatically flagging discrepancies against system records as soon as counts are entered.
FAQ
Q: How often should a small retail store do a stock count? A: Most small stores benefit from a full physical count at least once per year, with cycle counts on high-value or high-shrinkage categories monthly or quarterly. Stores with persistent shrinkage problems often find that counting high-risk categories weekly for a quarter catches the pattern faster than any annual audit.
Q: Do I need to close my store to do a stock count? A: Not necessarily. Full counts often require after-hours time to avoid transaction interference, but cycle counts — where you’re counting a defined zone or category — can be run during low-traffic hours without closing the store. The key is freezing the zone being counted while the count is in progress.
Q: What should I do when my physical count doesn’t match the system? A: Start by checking receiving records for the past 30 days against the discrepant SKUs. Many variances trace back to a shipment that was entered incorrectly or a return that wasn’t processed. If no transaction log explains the gap, and the variance is statistically significant, treat it as a potential theft or damage event and investigate accordingly. Consistent short-count patterns on specific SKUs tend to suggest deliberate causes rather than random counting errors.
Q: What’s a realistic inventory accuracy rate target for a small store? A: The general industry benchmark is ≥98%. That means for every 100 SKUs you count, no more than 2 should show a discrepancy outside your acceptable variance threshold. New stores or stores switching from paper-based tracking often start lower — 93–95% is common — and improve as processes tighten over two to four count cycles.
Q: Is cycle counting actually more accurate than doing one big annual count? A: Research suggests yes, in most retail contexts. McKinsey data indicates retailers using structured cycle-count programs reduce on-hand inventory errors by up to 34% compared to annual-only approaches. The core reason is frequency: counting more often means errors are caught and corrected faster, before they compound through additional transactions.