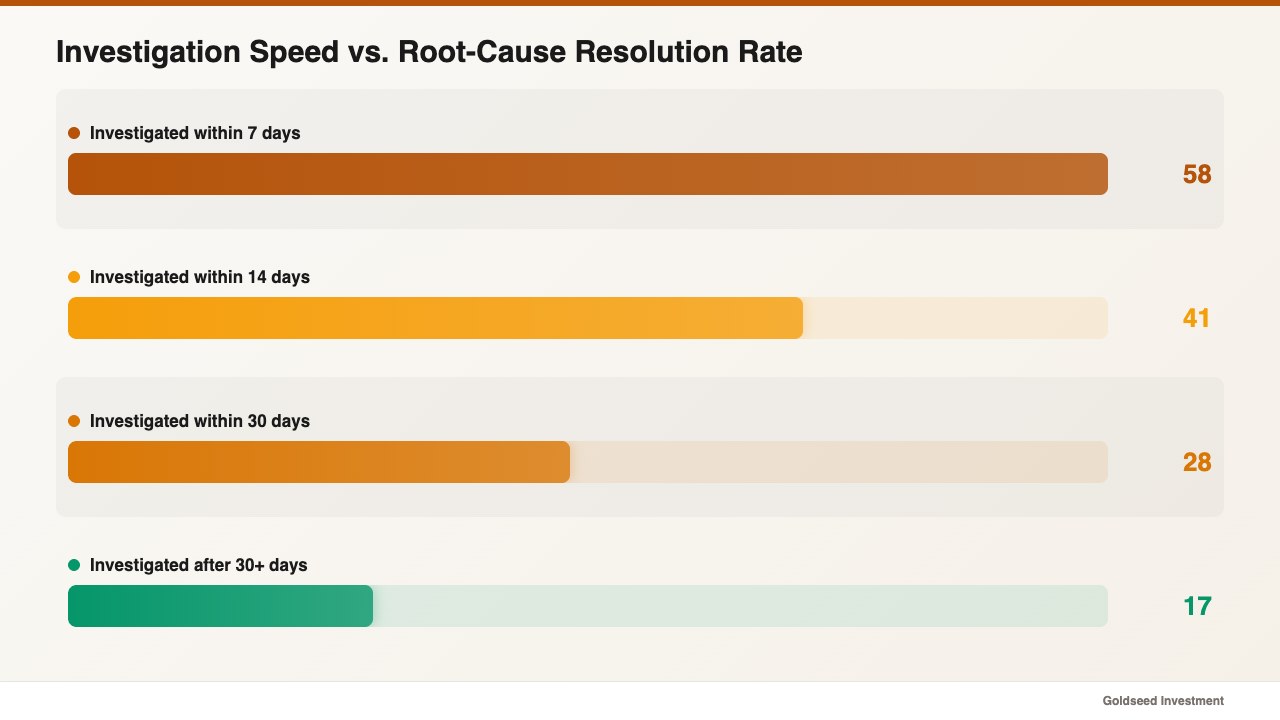
Retailers who investigate inventory variances within 7 days resolve the root cause in 58% of cases — those who wait 30+ days resolve only 17%, according to industry shrinkage reporting from 2024.
When Daniel reopened his specialty retail store after his Q3 2025 cycle count, the tally on one of his highest-margin SKUs came back eleven units short. The point-of-sale showed thirty-eight units on hand. The shelf held twenty-seven. He had no way to tell, sitting there with a clipboard at 9 p.m., whether those eleven units had been stolen, missed during a busy markdown weekend, or short-shipped by a vendor back in August. The dollar value of the loss was real and measurable. The cause was not.
That ambiguity is where most retail inventory loss investigations stall — and where the financial damage tends to compound. This guide walks through how to investigate retail inventory loss with a structured process so you can move from a number on a count sheet to a documented root cause and a fix you can apply going forward.
What Counts as Retail Inventory Loss — and Why Investigate It?
Retail inventory loss refers to any unexplained reduction in your on-hand stock that cannot be accounted for through recorded sales, transfers, or write-offs. It is closely related to but not identical to shrinkage. Shrinkage is the formal accounting figure that captures lost inventory expressed as a percent of sales. Inventory loss is the broader operational reality that produces that figure — and it is where the actual investigation work happens.
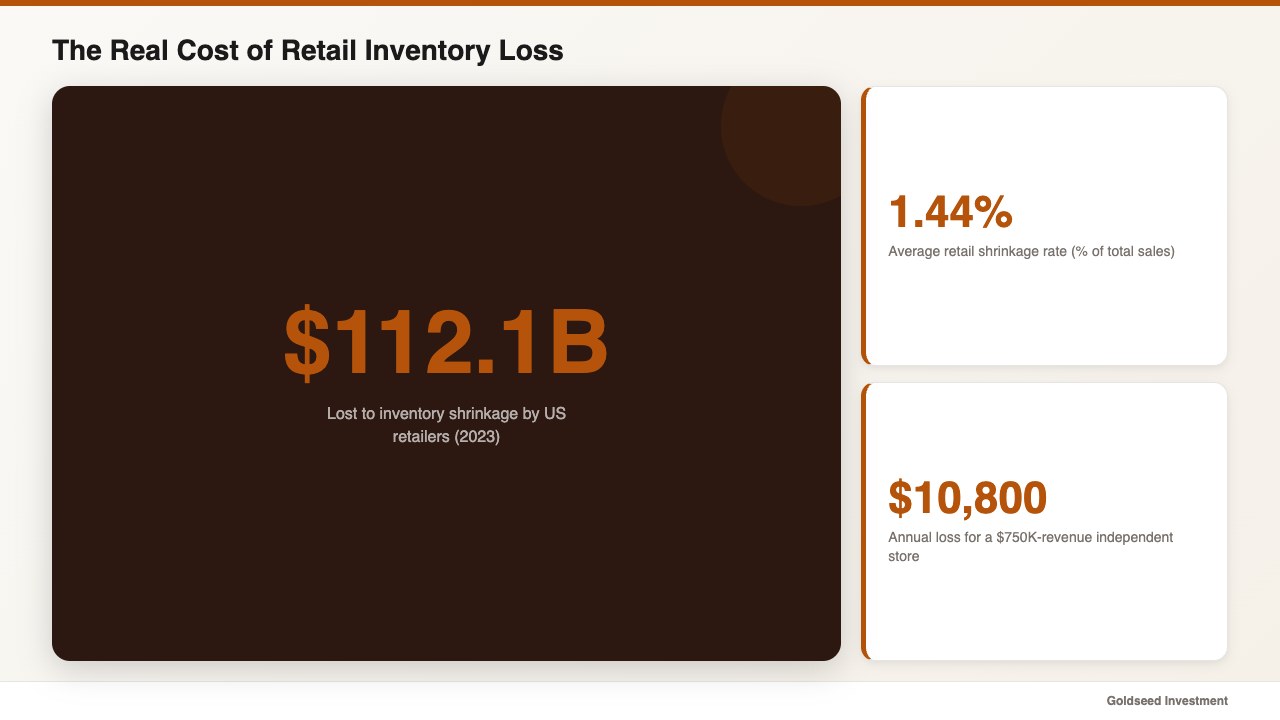
According to the National Retail Federation’s 2024 Security Survey, U.S. retailers lost $112.1 billion to inventory shrinkage in 2023. The average shrinkage rate landed at 1.44% of total sales. For an independent store doing $750,000 in annual revenue, that translates to roughly $10,800 in disappeared product per year — typically invisible until count day, and rarely tied back to a specific cause.
Investigating loss matters for three reasons that often get conflated. First, it tells you whether the loss is recurring (which suggests a systemic problem) or one-time (which suggests an isolated event). Second, it identifies which control to fix — a receiving process, a checkout procedure, a shift handoff, or a vendor relationship. Third, it builds the documentation trail you need if the pattern eventually points to a personnel issue or a vendor dispute. Without that documentation, you cannot act with confidence.
One retail operator described the moment her perspective shifted: “Before, when numbers didn’t match, I had no way to know if it was theft, a counting error, or a receiving mistake. I couldn’t act on any of it because I couldn’t identify the cause.” That sentence captures why investigation — not just counting — is the difference between knowing you have a problem and being able to fix it.
Where Does Retail Inventory Loss Actually Come From?
The instinct in most independent stores is to assume shoplifting accounts for the bulk of inventory loss. Industry data tells a different story. Research published by the Loss Prevention Research Council and reported through Retail Dive’s shrinkage coverage suggests that roughly 65% of total retail shrinkage stems from internal sources — employee theft, administrative error, vendor fraud, or process failure — rather than external shoplifting alone.
Loss generally falls into five categories that an investigation needs to distinguish:
External theft (shoplifting) — The visible category most owners think of first. It tends to cluster around high-value, easily concealable items. Pattern: random across days, frequently during busy periods.
Internal theft (employee) — Often overlooked because it feels uncomfortable to investigate. Pattern: consistent over time, frequently during specific shifts, often involving items that are easy to remove without scanning.
Administrative error — Wrong receiving counts, misclassified returns, transfers logged to the wrong store, double-deducted sales. The largest single category in many small retailers and the one most likely to be misdiagnosed as theft.
Vendor fraud or short-shipment — Cases received as full but actually short by one or two units, or substituted with lower-value items. Tends to repeat with the same vendor over time.
Process failure — Items damaged but not written off, items moved to a back stockroom and forgotten, layaway holds not subtracted from on-hand. Often masquerades as shrinkage until someone physically finds the missing units.
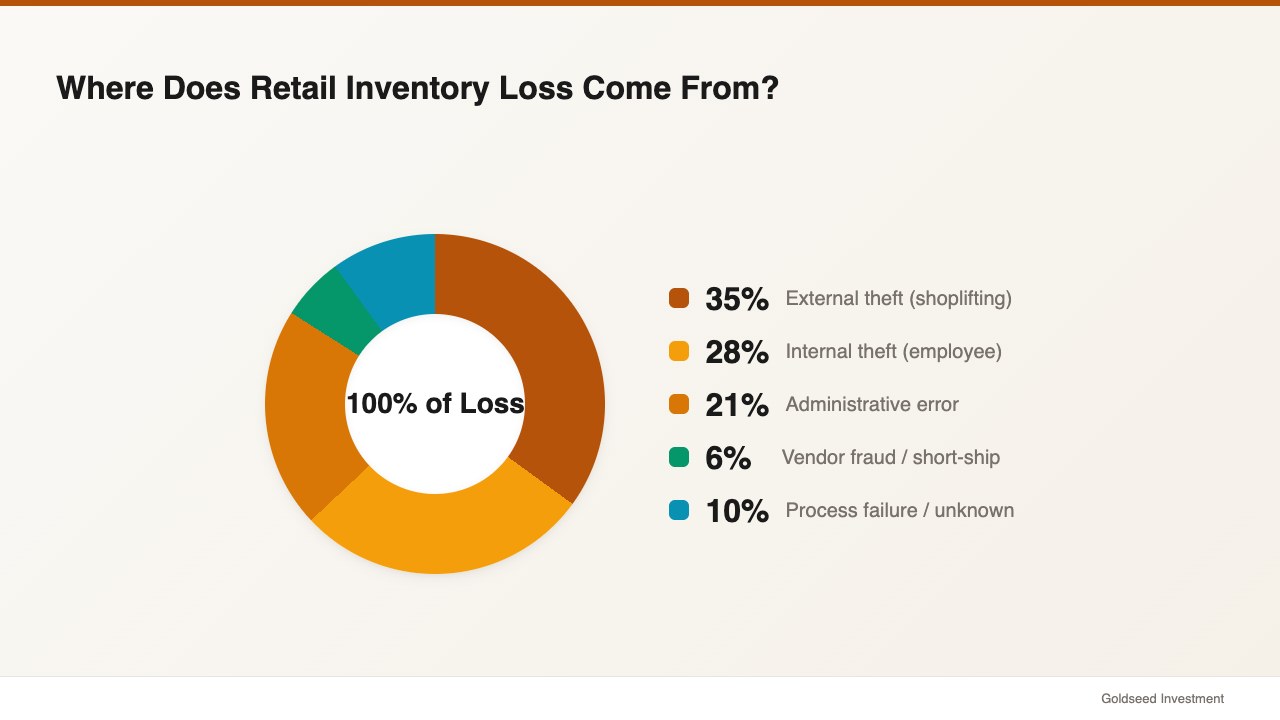
A useful starting frame is that the cause distribution suggested by industry research is roughly: external theft 35%, internal theft 28%, administrative error 21%, vendor fraud 6%, and process or unknown 10%. The exact mix varies by category, format, and region — but the implication is the same. If your investigation defaults to “shoplifting” without ruling out the other four causes, you tend to fix the wrong control and the loss continues.
How Do You Start an Inventory Loss Investigation?
A structured investigation begins before you accuse anyone of anything. The first move is always to confirm the loss exists in the way you think it does. Many apparent shrinkage events turn out to be data-entry issues, scan misses, or transfers that were never logged.
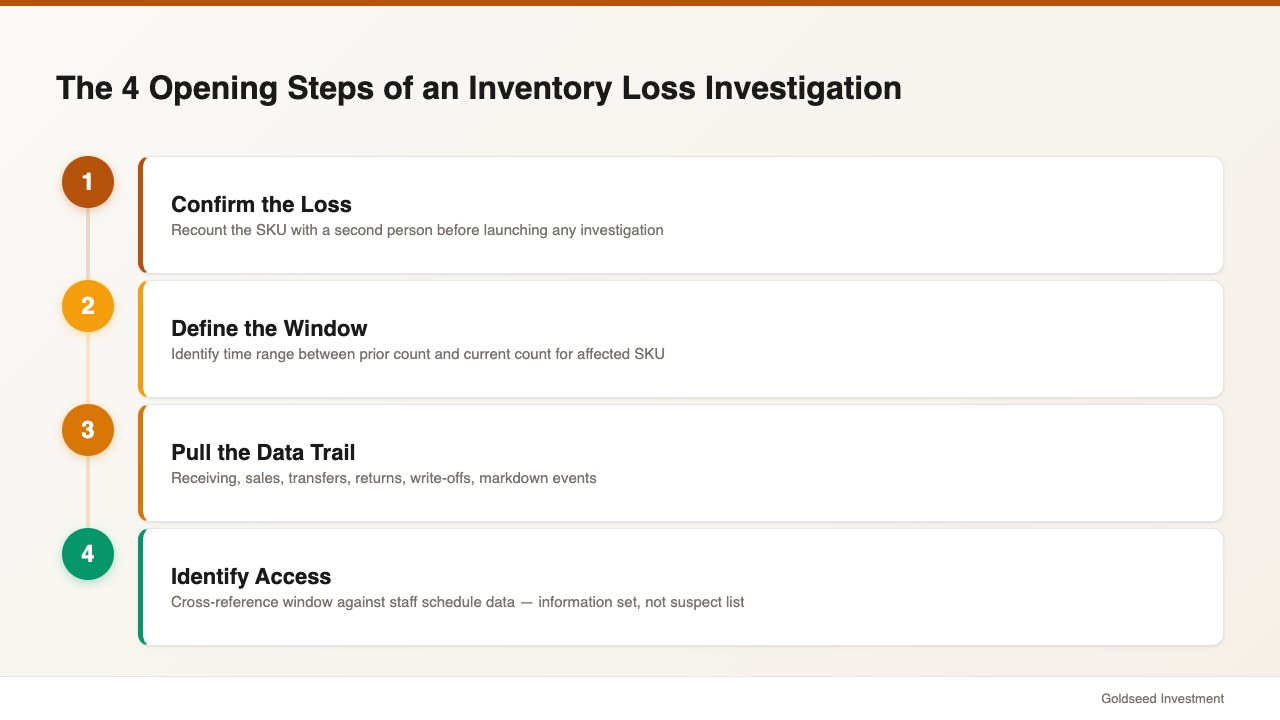
Run through these four opening steps in order:
Step 1 — Confirm the loss is real. Recount the affected SKU. Have a second person recount independently. If both counts match the original variance, the loss is confirmed. If the recount produces a different number, the original count was the issue and no further investigation is required.
Step 2 — Define the time window. Pull the date of the prior count for the same SKU. The loss happened somewhere between that count and now. A 90-day window is hard to investigate; a 14-day window is tractable. This is one reason cycle counting tends to outperform annual counts — it shrinks the investigation window dramatically.
Step 3 — Pull the data trail for the affected SKU. Receiving records, sales transactions filtered by SKU, inter-store transfers, returns and refunds, write-offs, and any markdown events. The goal is to reconcile every recorded movement against the system count.
Step 4 — Identify who had access. Cross-reference the time window against staff schedule data. List every person who worked the affected zone during the window. This list is not a suspect list — it is an information set. The point is to know who can answer questions if a pattern emerges later.
Pull your prior count history before you start formal interviews. If the same SKU has been off three counts in a row by similar amounts, the pattern itself is the most useful piece of evidence in the investigation. For a deeper walkthrough of the count process that supplies this trail, see this companion guide on how to do a retail stock count efficiently.
What Evidence Should You Gather Before Drawing Conclusions?
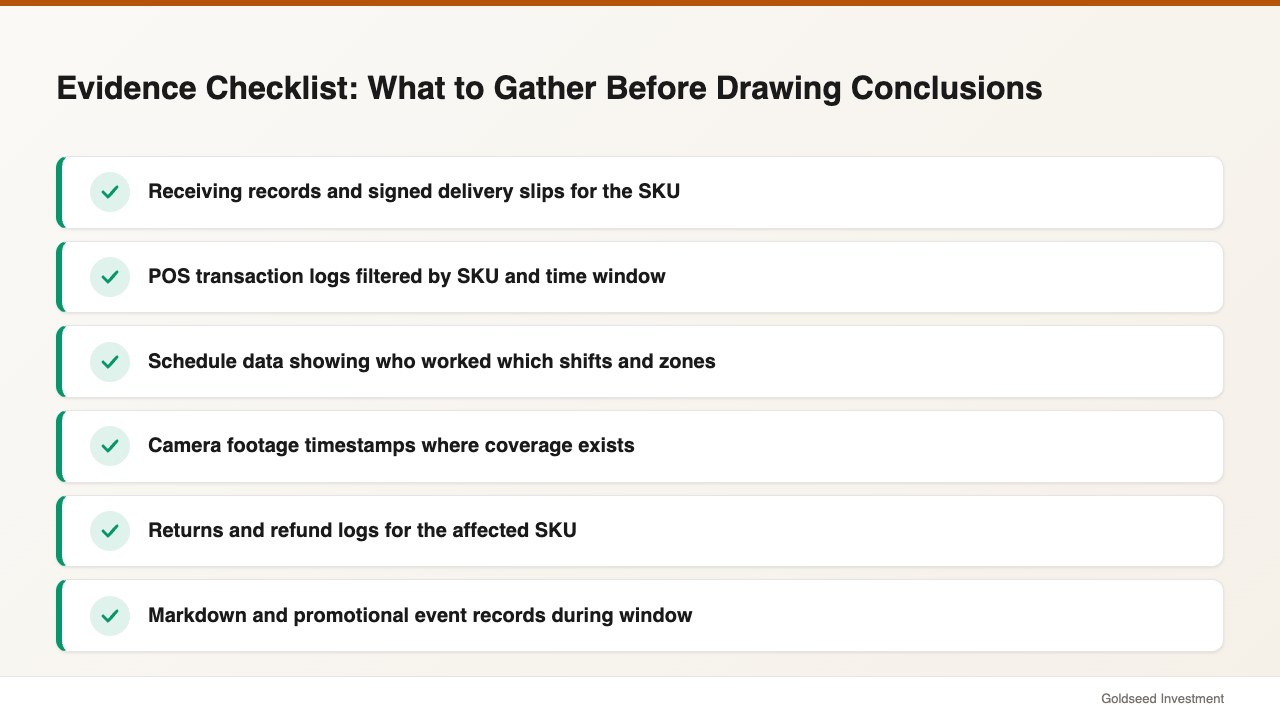
Investigations fail more often from missing evidence than from missing intuition. Before a single conversation about cause, an investigator should have these documents in hand:
- Receiving records and signed delivery slips for the SKU during the window
- POS transaction logs filtered by SKU and time
- Schedule data showing who worked which shifts and zones
- Camera footage timestamps where coverage exists
- Returns and refund logs for the SKU
- Markdown and promotional event records
- Prior count history for the same SKU across the last four cycles
- Any vendor short-ship or damage claims filed in the last 90 days
Each of these documents tends to answer a specific question. Receiving slips tell you whether the units actually arrived. POS logs tell you whether sales reduced inventory correctly. Schedule data tells you who was present. Camera footage, when available, tells you what happened during specific minutes. Prior count history tells you whether the loss is one-time or chronic.
Industry data from a 2025 Deloitte retail outlook noted that roughly 73% of retail leaders rank inventory accuracy and loss visibility as a top-three operational priority for the year ahead. Most of that priority hinges on the documentation discipline this section describes. A store that captures these data points routinely tends to investigate loss in hours; a store that has to reconstruct them after the fact tends to spend days and still come up uncertain.
Which Variance Thresholds Trigger a Full Investigation?
Not every variance warrants a full investigation. Investigating every single-unit discrepancy tends to consume staff time without producing actionable findings. The standard practice in mid-sized retail is to define variance thresholds in advance so that team members know what triggers escalation.
Common threshold defaults look like this:
- Low-value SKUs (under $20 cost): Investigate variances of ±3 units or more
- Mid-value SKUs ($20–$100 cost): Investigate variances of ±2 units or any dollar variance over $50
- High-value SKUs (over $100 cost): Investigate any variance, even single-unit
- Pattern threshold: Investigate any SKU off three counts in a row, regardless of size
- Statistical threshold: Investigate when total store variance exceeds 0.5% of inventory value in a single count
The pattern threshold is often the most useful and the most overlooked. A single-unit discrepancy on a low-value SKU might be noise; the same single-unit discrepancy across three consecutive counts is almost never noise. It tends to indicate either a chronic process error (consistent under-receipt, consistent shrink in a specific zone) or a deliberate pattern. Either way, it deserves attention.
The statistical threshold uses your store’s overall variance rate as the trigger. If your typical cycle count produces total variance under 0.3% of inventory value and a particular count comes in at 1.1%, the count itself is the signal. Something changed during that window. Investigate the window, not just the SKUs.
How Do High-Performing Retailers Resolve the Root Cause?
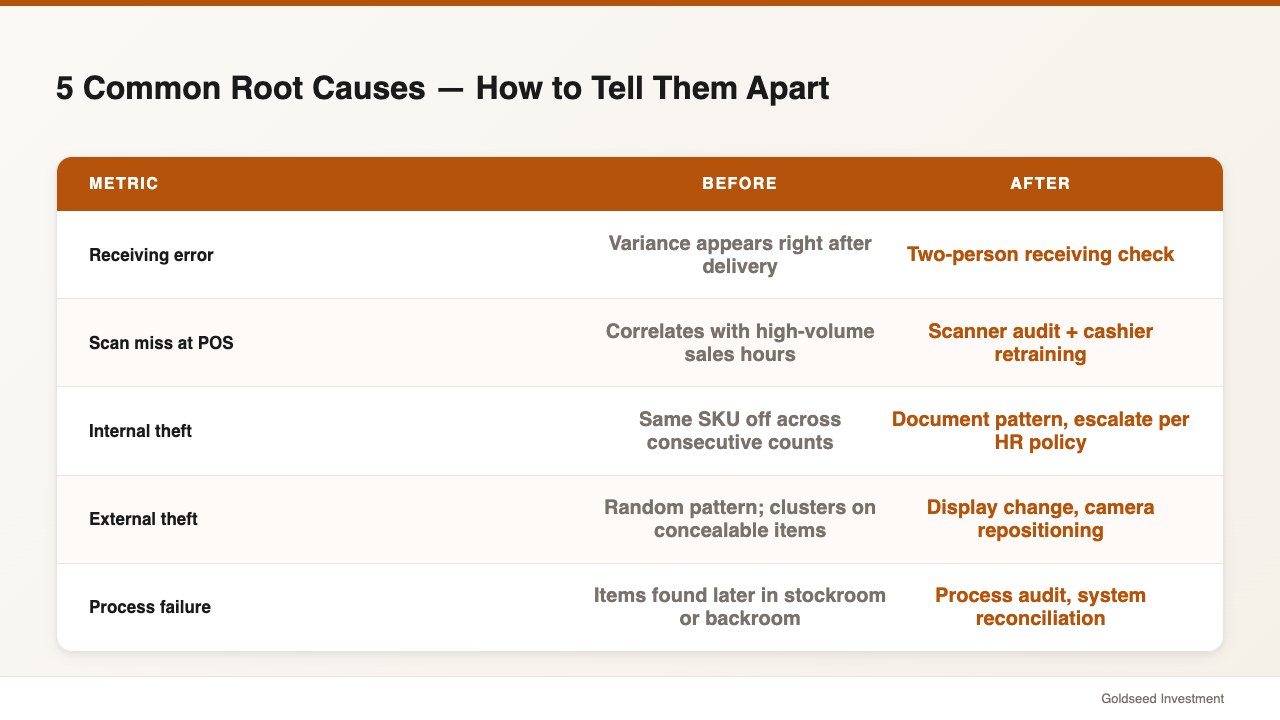
Resolving the root cause means producing a documented finding — not a guess — that explains why the loss occurred and what changes will prevent recurrence. The five most common findings in retail inventory investigations, and how to differentiate them in practice, look like this:
| Suspected Cause | Differentiating Signal | First-Move Fix |
|---|---|---|
| Receiving error | Variance shows up immediately after a delivery; vendor count differs from system count | Implement two-person receiving check |
| Scan miss at POS | Variance correlates with high-volume sales hours; specific UPC consistently off | Scanner audit + cashier retraining |
| Internal theft | Same SKU off across consecutive counts; correlates with specific shifts | Document pattern, escalate per HR policy |
| External theft | Random pattern; clusters on high-value, concealable items | Display change, camera repositioning |
| Process failure | Items found later in stockroom or backroom; layaway not subtracted | Process audit, system reconciliation |
Source: Loss Prevention Research Council, 2024; McKinsey Retail Inventory Insights, 2023
The differentiating signals matter. According to McKinsey research on retail inventory management, retailers using formal cycle-count and root-cause investigation programs reduce inventory error rates by up to 34% compared to those running annual counts only. Most of that 34% improvement comes from being able to distinguish causes — fixing the right control rather than guessing.
A retail operations leader once described the discipline this way: “You’re not solving for who did it. You’re solving for why this happens, every time, in this specific way. The ‘who’ question often answers itself once the ‘why’ is clear.” That framing tends to depersonalize an investigation, which makes it both more effective and easier to conduct without damaging staff trust.
When the evidence does point to internal theft, the next step is documented escalation through your HR policy — not an immediate confrontation. When the evidence points to a vendor short-ship pattern, the next step is a formal vendor dispute with the documentation you have gathered. For a related guide on the recurring metric this investigation produces, see this overview of convenience store inventory shrinkage rate benchmarks, which provides industry comparisons by store format.
What Mistakes Make a Retail Inventory Loss Investigation Fail?
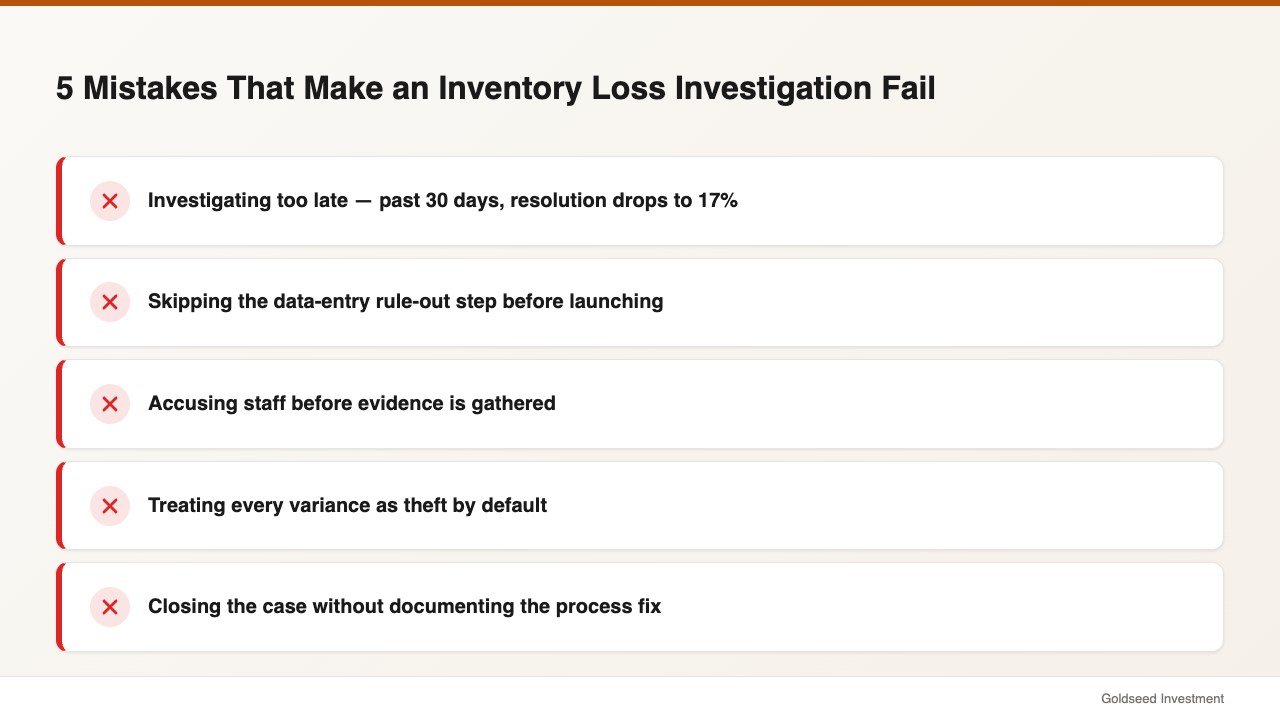
Most failed investigations share the same five mistakes. Recognizing them in advance tends to save days of effort:
Investigating too late. Industry data suggests that variances investigated within 7 days resolve to a documented root cause in roughly 58% of attempts. Variances investigated 30 or more days after the fact resolve in only 17%. Memory fades, schedules churn, camera footage gets overwritten. Speed compounds in your favor.
Skipping the data-entry rule-out step. Confirming the loss with a second count before launching an investigation prevents an enormous amount of wasted effort. A surprising share of “missing inventory” turns out to be miscounts, miskeyed receivings, or items physically present but stored in the wrong location.
Accusing staff before evidence is gathered. Premature accusations damage trust, reduce future cooperation, and rarely produce confessions. Build the evidence file first; have the conversation second. If the evidence supports the conclusion, the conversation is short. If the evidence does not, you have spared yourself a permanently damaged working relationship.
Treating every variance as theft. Defaulting to a theft hypothesis means you stop looking after the first piece of evidence that fits. The five-cause framework forces you to consider all possibilities before settling on one.
Closing the case without documenting the fix. An investigation that ends with “we figured it out” but does not produce a written process change tends to recur. The fix — whether it is a receiving procedure, a scanner audit, a schedule change, or a control process — needs to be documented, communicated, and verified at the next count.
A useful discipline is to require every closed investigation to produce three artifacts: a one-page written finding, a specific process change with an owner, and a re-check at the next cycle count. Stores that follow that discipline tend to see their overall shrinkage rate decline meaningfully over a six- to twelve-month horizon. Stores that do not tend to keep investigating the same losses.
What’s the Real Cost — and ROI — of Investigating Loss Properly?
The cost side of the calculation is straightforward. A typical investigation for a single SKU consumes 2 to 6 hours of management time when documentation is in place and 1 to 2 days when it is not. At a fully loaded management cost of roughly $35 to $50 per hour, the per-investigation cost falls between $70 and $800.
The return side is where the math gets interesting. For a store doing $750,000 in revenue with a 1.44% shrinkage rate, the annual loss runs around $10,800. Bureau of Labor Statistics data on retail trade payroll suggests that labor and inventory together represent the two largest controllable cost lines for store owners, and that even a 25% reduction in shrinkage often funds the labor cost of investigation many times over. A store that cuts its shrinkage rate from 1.44% to 1.10% recovers roughly $2,550 annually on $750,000 of sales — meaningful margin against a process change that, in many cases, costs only structured time.
The other return is harder to quantify but tends to compound: every documented investigation builds operational discipline. Staff understand that variances will be investigated. Vendors understand that short-ships will be caught. Processes that produced losses get rewritten. Over time, the rate of new losses tends to fall faster than the investigations themselves cost to run.
FAQ
Q: How quickly should I start investigating a retail inventory loss after I find it? A: Within 7 days produces resolution in roughly 58% of cases; waiting 30+ days drops resolution to about 17%. Speed matters because schedule data, camera footage, and staff memory all degrade quickly. For the broader counting process that surfaces these variances, see the related guide on retail stock count process.
Q: What is the difference between inventory loss and shrinkage? A: Shrinkage is the formal accounting figure expressed as a percent of sales (industry average 1.44% in 2023 per NRF). Inventory loss is the operational reality — the actual missing units — that produces shrinkage when summed up. Investigation work focuses on inventory loss; reporting focuses on shrinkage.
Q: When should I investigate a single-unit variance? A: Investigate single-unit variances when the SKU is high value (over $100 cost), when the same SKU has been off three counts in a row, or when total store variance exceeds 0.5% of inventory value in a single count. Most other single-unit variances tend to be statistical noise.
Q: How do I tell internal theft apart from administrative error? A: Internal theft tends to repeat across counts, correlates with specific shifts, and concentrates on items that are easy to remove without scanning. Administrative error tends to appear once or twice, correlates with specific events (receiving days, markdown weekends, returns batches), and resolves with a process fix rather than a personnel action. For ongoing tracking systems that surface these patterns, see this overview of retail inventory accountability tracking.
Q: Should I involve law enforcement when I suspect employee theft? A: Document the evidence first, follow your HR policy second, involve legal counsel third, and only then consider law enforcement. Premature law enforcement involvement before evidence is documented tends to produce poor outcomes and can expose the business to liability if the suspicion turns out to be wrong.