Retailers using Storebase’s real-time chain dashboard cut cross-store check-in time from 6 hours/week to under 30 minutes and catch cash discrepancies the same day they happen — instead of three days later.
Diana Park used to know her four convenience stores were losing money — she just couldn’t tell which one, or when, or why, until the monthly close. Two locations in San Diego, two in Riverside. Every Monday morning, six hours of phone calls, two spreadsheets, and a thick folder of cash drawer logs that always seemed to be missing one.
Then she switched to Storebase, and the math changed within thirty days. Combined weekly check-in time dropped from 6 hours to 28 minutes. Cash variances that used to surface 72 hours late now flagged within minutes. Her monthly close went from a half-day spreadsheet exercise to a 30-minute review on her phone. “For the first time since I opened Store 3, I actually know what’s happening in all four locations — without driving anywhere,” she said.
What changed wasn’t her stores or her staff. It was the visibility layer underneath them. A real-time retail chain dashboard — one screen with live sales, cash, labor, and inventory across every location — turned out to be the difference between running a chain and being run by one.
This guide walks through what a real-time retail chain dashboard actually shows, the hidden cost of waiting until month-end to find out what happened, and how operators monitor 2–10 stores from a single screen in 2026.
Why Do Retail Chain Owners Still Run Their Stores Half-Blind?
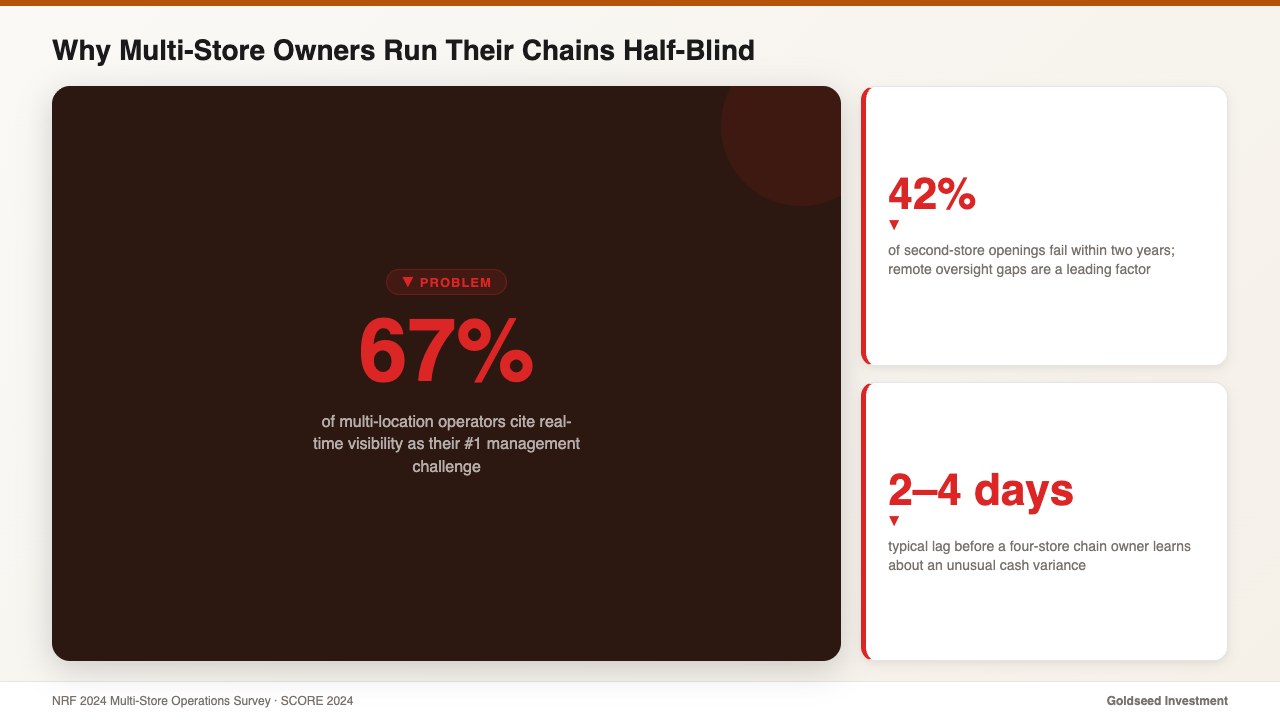
According to a 2024 NRF multi-store operations survey, 67% of multi-location retail operators cite real-time visibility as their #1 management challenge — ahead of inventory cost, hiring, and even local competition. Not knowing what is happening across the chain right now is, by their own ranking, the hardest part of the job.
The pattern is consistent. A four-store chain owner typically learns about an unusual cash variance 2–4 days after it happens. Inventory shrinkage at one location is usually caught at month-end count — by then, the shelf data is two to four weeks old. Labor overruns are identified at payroll review, not in the moment, which means the budget is already gone.
Phone calls and end-of-week spreadsheets are the default tooling for chains under ten stores. Both have the same flaw: they are batch processes pretending to be live. Owners ask, managers respond, the picture gets stitched together hours or days after the fact. By then the decision window has closed.
SCORE’s 2024 small business research found that 42% of second-store openings fail within two years, and remote oversight gaps are consistently among the top three contributing factors. The product is fine. The location is viable. The owner simply can’t stay ahead of what’s happening in two places — let alone four — at once.
What Does a Real-Time Retail Chain Dashboard Actually Show?
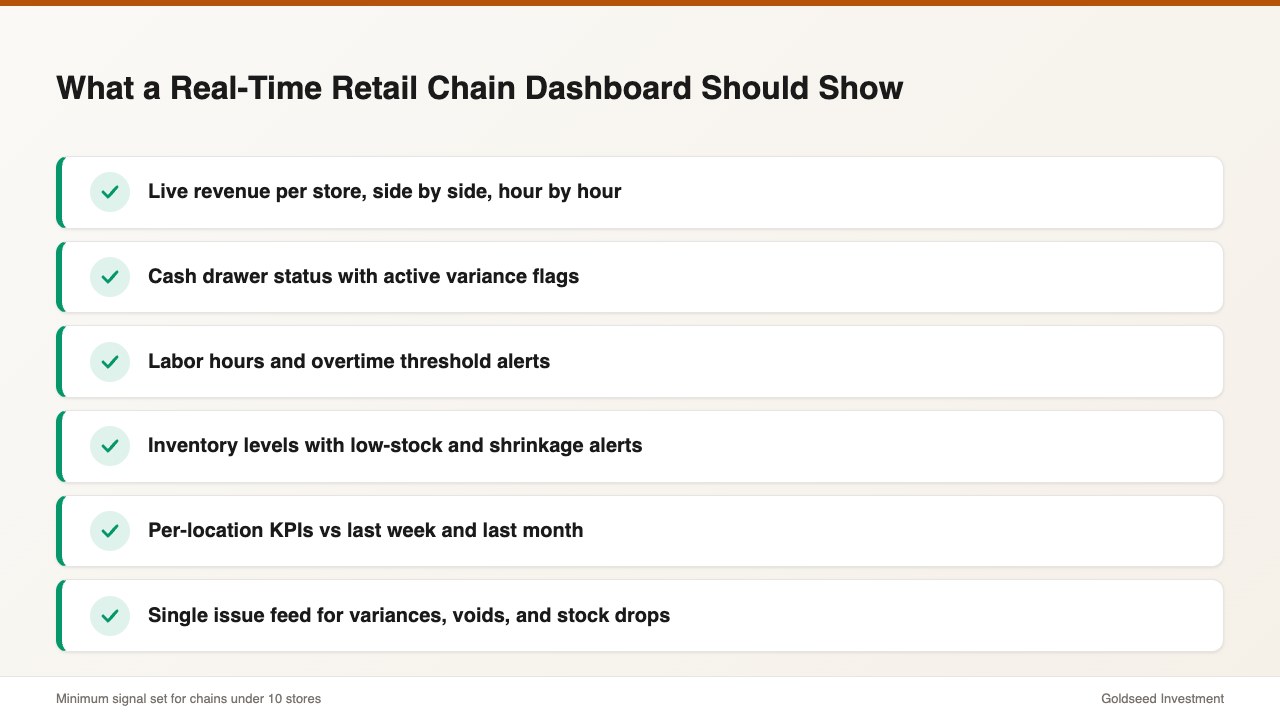
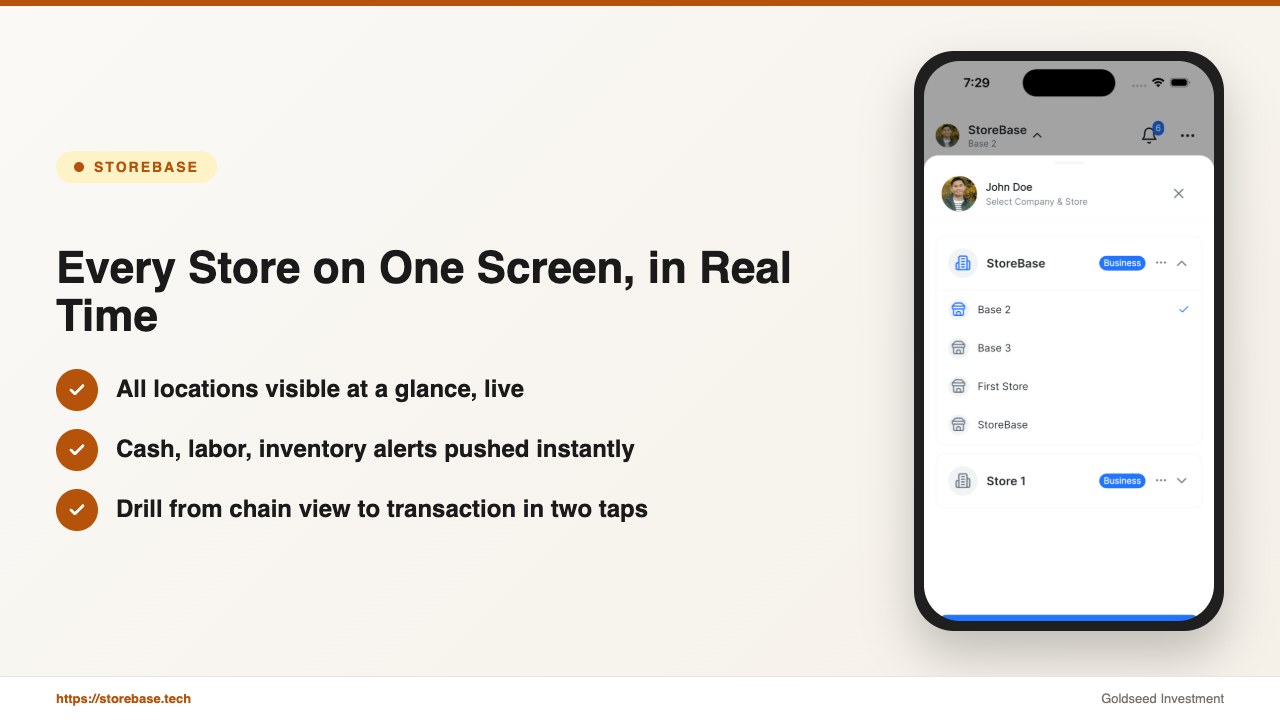
A real-time retail chain dashboard isn’t a fancier version of a sales report. It’s a single screen — usually on the owner’s phone — that displays the live state of every location in the chain at once. The minimum useful set of signals:
- Live revenue per store: today’s sales, hour-by-hour, side by side across all locations
- Cash drawer status: opening float, current count, expected close, and any active variance flags
- Labor hours and overtime alerts: clock-in roster per location, projected weekly hours, and threshold warnings before overtime triggers
- Inventory health: stock levels, low-stock alerts, and recent stock movements with a staff ID attached
- Per-location KPIs: gross margin, sales per labor hour, conversion rate (where the POS feeds it), comparable to last week and last month
- Issue feed: a single stream of anything unusual — a cash variance, a missing clock-out, a high-value void, a sudden inventory drop
The mark of a real dashboard, versus a report disguised as one, is whether the owner can drill down. Tap revenue at Store 3, see the live POS feed. Tap a cash flag at Store 1, see who entered the variance and when. Tap an overtime warning at Store 4, see the schedule that caused it. Real-time means a chain of evidence, not a single number.
For context on what healthy multi-store financial benchmarks look like before evaluating any dashboard, retail store profit margin benchmarks by category is a useful baseline.
How the Cost of “Knowing Late” Quietly Drains a Retail Chain
Lag is not a neutral state. Every day a retail chain operates without real-time visibility, money walks out the door in three predictable ways.
1. Cash variances age into write-offs. A $180 till short on Tuesday is recoverable on Tuesday — staff remember the shift, the customer, the coin drawer reload. The same $180 short discovered the following Monday is almost always written off. Operators report that variances over 72 hours old are typically unrecoverable in 80%+ of cases. Across four stores, two unresolved variances per month at $200 each compounds to $4,800/year — silently.
2. Shrinkage compounds before month-end count. Inventory drift caught at day-of is investigable. The same drift caught at month-end count is statistical noise that goes into the COGS line. The 2024 NRF Retail Security Survey put the average retail shrinkage rate at 1.6% of sales — for a $2M/year chain, that is $32,000. Real-time monitoring won’t eliminate it, but operators consistently cut it 30–50% by surfacing the events fast enough to act.
3. Labor overruns happen on Tuesday and get billed on Friday. Without live overtime alerts, schedule overruns are reviewed at payroll. By then the dollars are already committed. McKinsey’s 2024 retail productivity benchmarks found that real-time KPI monitoring is associated with 11–14% higher labor productivity at multi-store retailers — almost entirely from earlier intervention, not better hiring.
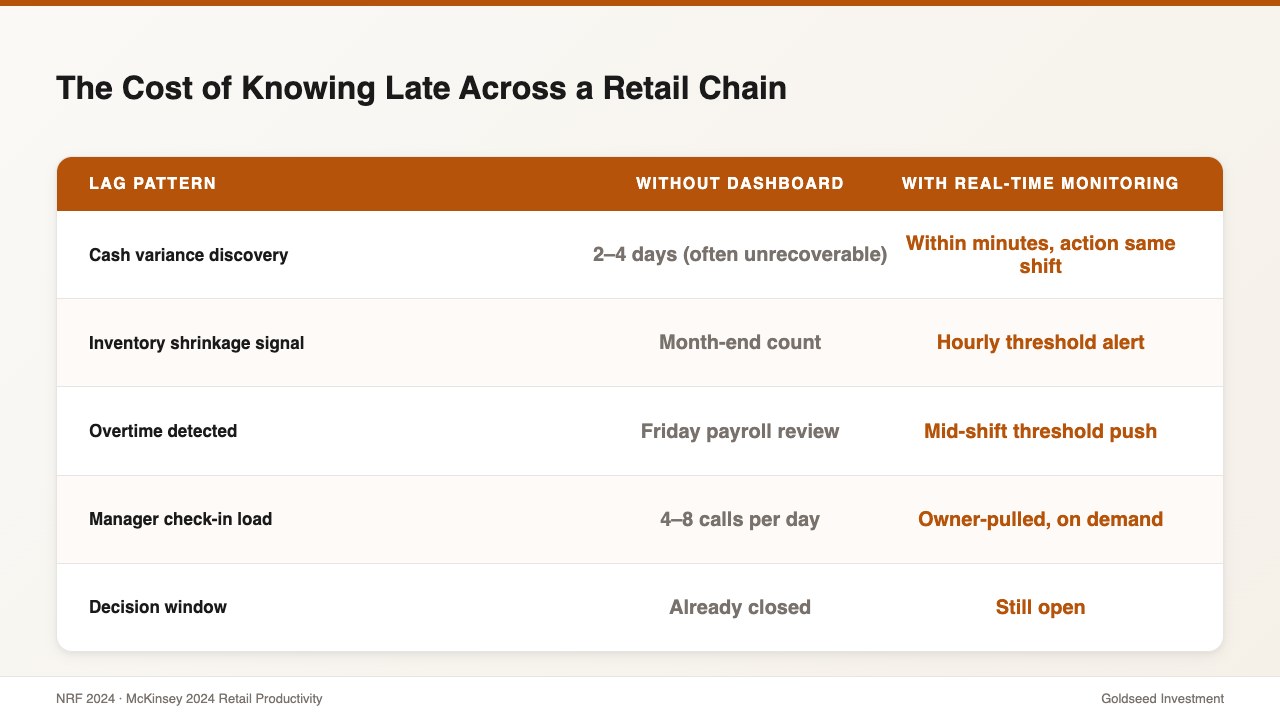
| Lag pattern | Without real-time dashboard | With real-time monitoring |
|---|---|---|
| Cash variance discovery | 2–4 days (often unrecoverable) | Within minutes (action same shift) |
| Inventory shrinkage signal | Month-end count | Hourly threshold alert |
| Overtime detected | Friday payroll review | Mid-shift threshold push |
| Manager check-in load | 4–8 calls/day | Owner-pulled, on demand |
| Decision window | Already closed | Still open |
How Do Top Multi-Store Operators Monitor Their Chains in 2026?
There are three working approaches to monitoring a 2–10 store chain. Each has a different cost profile and a different ceiling.
Option 1 — Trusted store managers + weekly check-ins. The traditional model. Works when managers are excellent and turnover is low. The hidden cost is information asymmetry: the owner only knows what each manager chooses to surface. Average annualized cost: $40,000–$60,000 per location for a senior manager, plus the ongoing trust risk.
Option 2 — Fragmented tools (POS reports + scheduling app + accounting software + cash log spreadsheets). Most common for chains under five stores. Cheap to start. Expensive in time. Each tool gives a partial view. The owner is the integration layer, manually merging four sources into one weekly picture. Typical admin load for four stores: 25–35 hours/month.
Option 3 — Integrated multi-store platform with a real-time chain dashboard. Single login. Unified data. Live view of every location. Higher setup cost (a day or two to onboard each store), much lower ongoing cost. Typical admin load for four stores: 4–6 hours/month — a 5–7× reduction.
Most “best POS” rankings won’t help here, because POS systems are designed around transactions, not chain-wide oversight. A purpose-built back-office platform sits on top of any POS — Square, Clover, Toast, Lightspeed, or any other — and adds the cash, labor, inventory, and financial layers that the POS doesn’t track on its own. Owners do not switch their POS to add a chain dashboard; they layer one above it.
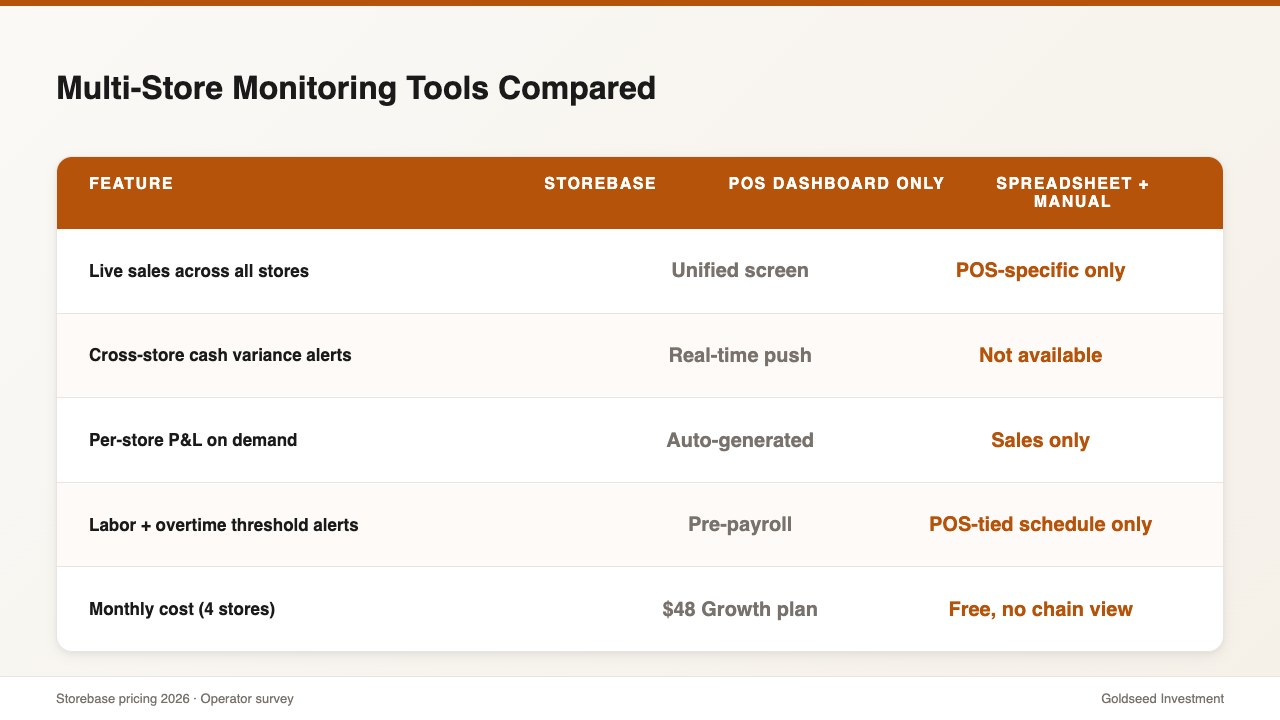
| Feature | Storebase | POS dashboard only | Spreadsheet + manual |
|---|---|---|---|
| Live sales across all stores | ✅ Unified screen | ⚠️ POS-specific only | ❌ Not possible |
| Cross-store cash variance alerts | ✅ Real-time push | ❌ Not available | ❌ Manual reconciliation |
| Per-store P&L on demand | ✅ Auto-generated | ❌ Sales only | ⚠️ Manual stitching |
| Labor + overtime threshold alerts | ✅ Pre-payroll | ⚠️ POS-tied schedule only | ❌ Caught at payroll |
| Inventory accountability log | ✅ Staff ID + timestamp | ❌ Not tracked | ❌ Not possible |
| Monthly cost (4 stores) | $48/mo (Growth — up to 5 stores) | $0 (POS already paid) but no chain view | Free, but 28+ hrs/mo labor |
The cost of Option 2 is rarely the subscription fees. It’s the 25–35 hours per month per chain that disappear into reconciliation work — time that cannot be reinvested into hiring, expansion, or actually walking a store floor. Operators evaluating a second-store opening typically reach this conclusion within the first 90 days of running two locations on fragmented tools.
How Storebase Turns a Retail Chain Dashboard Into Real-Time Control
Diana’s switch to Storebase didn’t change which stores she had or how many staff she employed. It changed how fast she could see what was happening across all four locations. Four features did most of the work.
1. The Multi-Store Dashboard replaced her morning phone calls. All four stores now appear on a single screen: yesterday’s revenue per location, current cash position, active labor hours, low-stock alerts, and any open issues. Diana opens the app over breakfast and reads the chain in under two minutes. No calls. No spreadsheets. The 6 hours/week of cross-store check-ins dropped to 28 minutes — about 95% recovered time.
2. Cash Management surfaced variances inside the same shift. Before the switch, a $145 till short at Store 2 would be discovered Wednesday morning when Diana finally got to the cash logs. With the Cash Management module, every cash entry — drawer count, deposit, safe transfer — is logged with a staff ID and timestamp. A discrepancy alert hits Diana’s phone the moment the close-out doesn’t reconcile. In her third week on the platform, the system flagged a recurring $40 short at Store 4 across three consecutive evenings — same shift, same employee. The accountability log traced it to a counting error, not theft, but having a log at all changed how staff at all four locations approached the close.
3. Sales & Finance generated per-store Income Statements automatically. Diana’s old monthly close meant exporting POS data from four locations, importing into spreadsheets, and manually merging into a chain P&L. The Sales & Finance module generates a real-time Income Statement for each location individually and rolls them up into a chain view — updated as transactions flow in. Combined monthly close went from 5+ hours to 28 minutes, and for the first time Diana could compare gross margin per store without rebuilding the workbook.
4. Inventory accountability tied stock changes to people, not just counts. The Inventory module tracks every stock adjustment — receiving, transfer, write-off, sale — with a staff ID, location, and timestamp. When shrinkage at Store 3 ticked up in February, Diana had a clear audit trail within minutes instead of waiting for the quarterly count. The issue was caught in week two, not month three.
The pattern is consistent across operators: the chain dashboard is the gateway, but the value compounds because cash, labor, inventory, and financial reporting all flow through the same screen. Owners stop bouncing between four apps and four tabs.
If your chain is still running on morning phone calls and end-of-month spreadsheets, Storebase is built for exactly this. Most multi-store operators are fully set up within two days, see their first automated chain-wide monthly close within 30 days — no credit card required. Start with the Multi-Store Dashboard → or Download on the App Store →.
Is Real-Time Monitoring Worth the Cost for a 2–10 Store Chain?
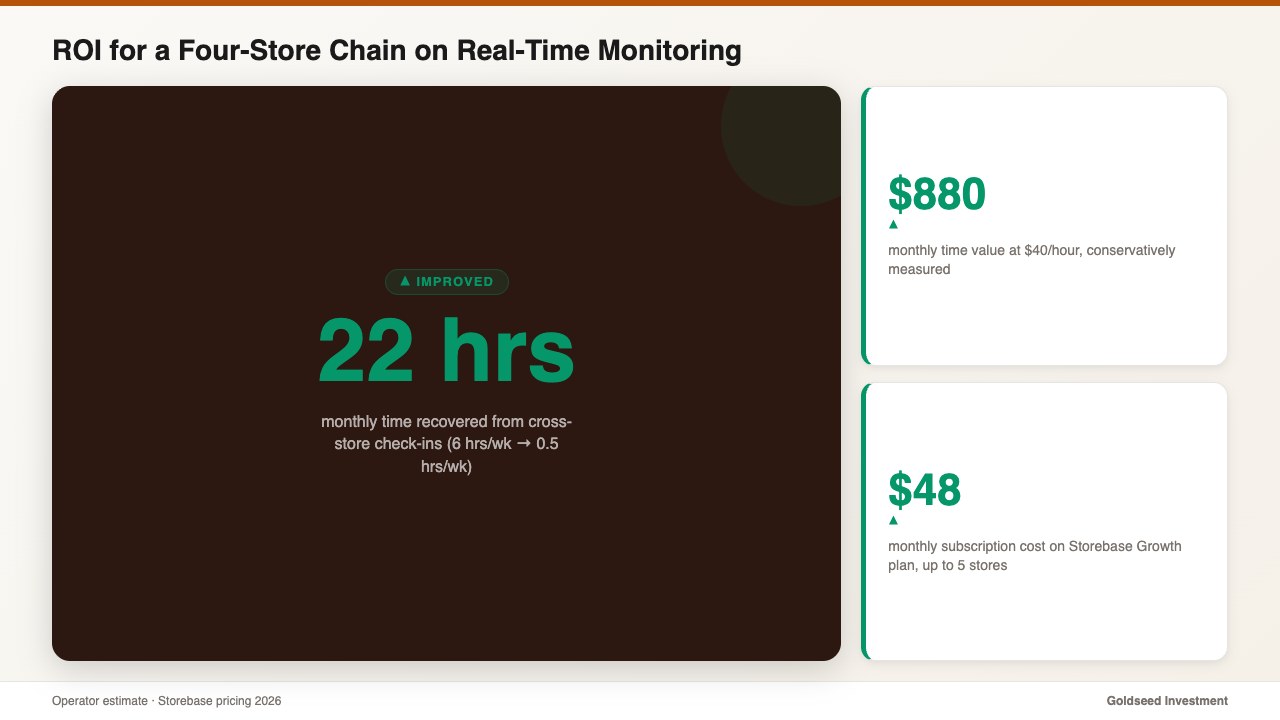
The honest answer for chains in this range is yes, but the ROI shows up in time recovered, not features added. The math for Diana’s four-store chain looked like this:
- Time recovered: 6 hours/week of check-ins → 0.5 hours/week = 22 hours/month saved
- Cash variance recovery rate: from ~20% (3-day lag) to ~80% (same-shift detection) — roughly $300/month recovered across four locations
- Growth plan: $48/month (covers up to 5 stores, no per-location fees)
- Conservative time value at $40/hour: 22 hours × $40 = $880/month
- Net monthly value vs. cost: ~$1,130 in recovered time and cash, against $48 in subscription cost
Payback in the first month, every month. For chains with 6–10 stores, the Business plan is $149/month (up to 10 stores) — the same math runs at roughly 4–5× the magnitude because the time savings scale linearly with location count.
The harder-to-quantify benefit is decision quality. When the dashboard is live, decisions are made on current data. The shift between knowing today vs. knowing Friday is the difference between intervention and post-mortem. Operators who scale from four stores to six or eight typically have unified visibility well before they need it for the next location, not after. For the financial reporting side of this same shift, retail financial management software that generates Income Statements automatically covers what month-end actually looks like once the chain dashboard is in place.
FAQ
Q: Does a real-time retail chain dashboard work with my existing POS? A: Yes. A purpose-built chain dashboard is designed to sit on top of any POS — Square, Clover, Toast, Lightspeed, or any other — and does not require all stores to use the same POS. Your POS continues to handle transactions; the chain dashboard pulls live sales, layers in cash, labor, inventory, and financials, and shows everything across all locations on one screen.
Q: How many stores do I need before a real-time chain dashboard is worth it? A: Two stores is the practical break-even. The visibility gap is largest at the second-store opening, when admin load triples instead of doubling. Most operators see a clear ROI from two locations onward; chains of four or more recover the platform cost in time savings within the first month.
Q: What is the difference between a POS report and a real-time retail dashboard? A: A POS report shows transactions in the past tense — usually filtered by store and exported. A real-time chain dashboard shows live sales, cash position, labor hours, and inventory across every location at once, with alert thresholds that push notifications when something needs attention before it becomes a problem.
Q: Can a chain dashboard alert me if a single store has a cash discrepancy? A: Yes. A real-time cash module logs every cash entry with a staff ID, timestamp, and store location. The dashboard surfaces variances as alerts in real time, and the audit trail shows exactly who entered what and when at the location where the discrepancy occurred — without waiting for end-of-week reconciliation.
Q: How long does it take to set up a real-time monitoring dashboard for a small retail chain? A: Most 2–10 store operators complete initial onboarding in 4–8 hours per store, typically spread across two evenings. The first chain-wide monthly close on the new system usually takes under 30 minutes — compared with 5+ hours of manual reconciliation across four locations.
Get Every Store on One Screen
If real-time monitoring across your chain still means a Monday morning of phone calls, Storebase closes that loop. Most owners are running every store on one screen by day two, with a chain-wide P&L close in under 30 minutes by week four — no credit card required. Start free with the Multi-Store Dashboard → or Download on the App Store →.