David Kim had been running his athletic goods store in Atlanta for six years. Revenue was growing. He knew his monthly sales numbers well. When he applied for a $200,000 business loan in 2025 to open a second location, the bank asked for a balance sheet. He didn’t have one — not because his finances were a mess, but because he had never been required to prepare one. The loan officer told him she couldn’t assess his $380,000 inventory position, his equipment value, or his debt obligations without it. He walked out without the loan.
Every retail owner needs a retail store balance sheet template and a process for keeping it current. Lenders require it, investors expect it, and — perhaps most importantly — it tells you whether your business is financially healthy in a way that a P&L statement alone cannot.
This guide explains what a retail store balance sheet is, walks through each section, covers the key ratios that matter most for retail, and shows you how to build one step by step. Whether you’re a single-store owner or managing a small retail chain, getting your balance sheet right in 2026 is one of the most important financial actions you can take.
What Is a Balance Sheet and Why Every Retail Owner Needs One
Put simply, a balance sheet is a financial statement that captures the financial position of a business at a specific point in time — typically month-end, quarter-end, or year-end. It’s built around a single equation that must always hold true:
Assets = Liabilities + Owner’s Equity
Both sides must balance. If they don’t, something has been miscategorized or omitted. Unlike an income statement, which shows revenue and expenses over a time period, a balance sheet is a snapshot: Right now, on this date, what does this business own and what does it owe?
Retail store owners rely on the balance sheet for several real purposes:
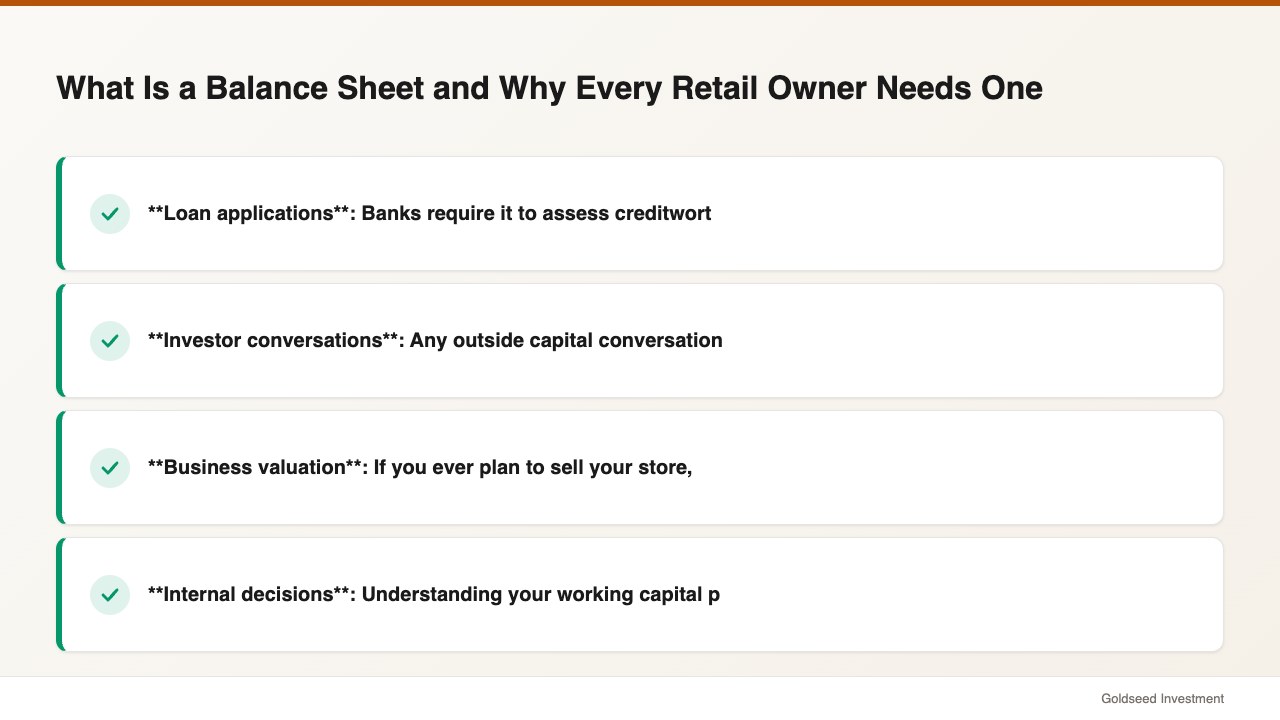
- Loan applications: Banks require it to assess creditworthiness. Without one, your application stalls immediately.
- Investor conversations: Any outside capital conversation starts with a balance sheet review.
- Business valuation: If you ever plan to sell your store, buyers want to see it.
- Internal decisions: Understanding your working capital position helps you decide when to place large inventory orders, when to pay down debt, and whether you can afford a new hire.
According to Square’s small business finance guide, best practice is to prepare a balance sheet monthly — especially for retail stores where inventory, cash, and accounts payable fluctuate significantly month to month. Annual-only balance sheets make it difficult to catch problems early.
Retail Current Assets: Cash, Inventory, and Receivables
Current assets are resources the business expects to convert to cash within 12 months. In most retail balance sheet examples, the current assets section is the largest — and merchandise inventory tends to be its most significant line.
Here is what a typical retail store assets section includes:
Cash and Cash Equivalents: Checking account balance, savings held in business accounts, and petty cash on hand in the store. Cash position in retail fluctuates week to week based on sales cycles and bill payment timing. Many owners underestimate how much cash they need to keep liquid during slow seasons — a problem that shows up clearly on a monthly balance sheet but stays hidden on annual reporting.
Accounts Receivable (A/R): Money owed to you by customers or wholesale buyers. Pure brick-and-mortar retail with no wholesale accounts often shows zero here. If you extend credit to commercial clients or run a B2B channel alongside your retail floor, this line can be significant.
Merchandise Inventory: This is the largest current asset for most retail stores. Recorded at cost — not retail price — this line includes all goods held for sale, both on the floor and in the back room. As Lumen Learning’s Retail Management course notes, merchandise inventory is a current asset because it can typically be liquidated quickly at low prices if needed. The valuation method matters: FIFO vs. LIFO vs. weighted average cost each affects how this number looks.
Prepaid Expenses: Costs already paid but not yet consumed — prepaid insurance, software subscriptions, or security deposits. These are technically assets until the service is delivered.
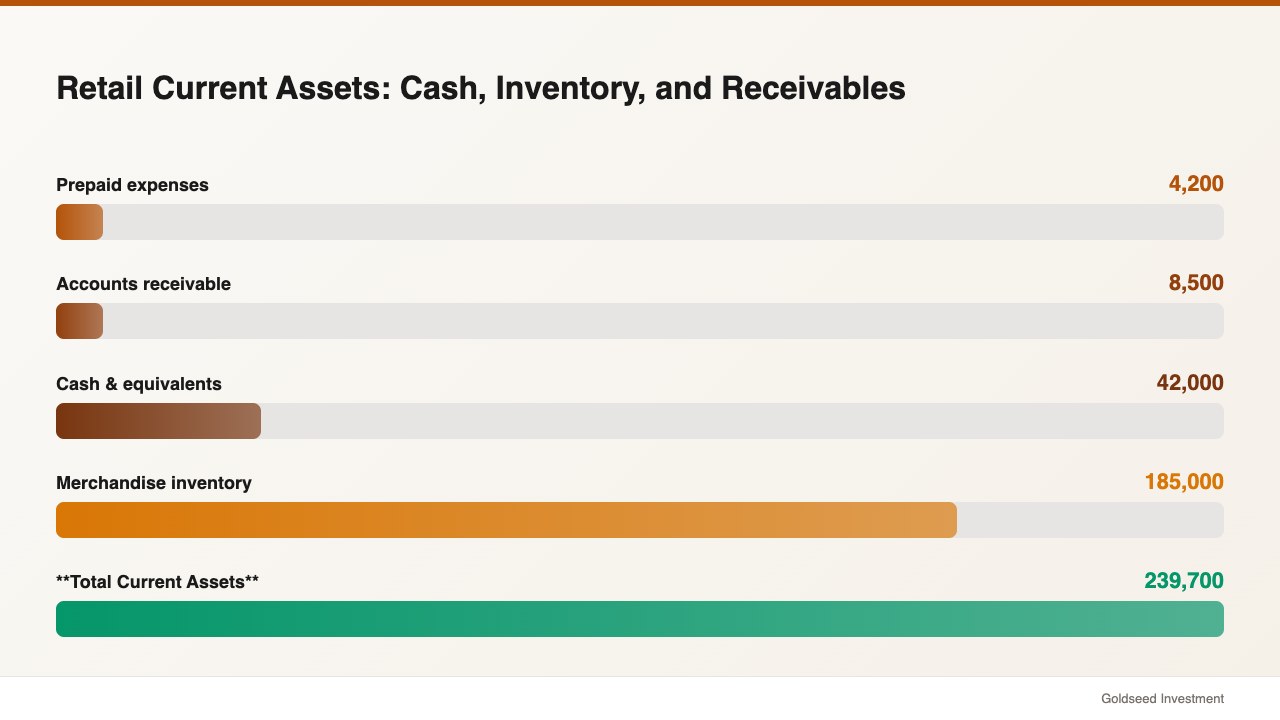
A sample current assets section for a mid-size specialty retailer in 2026 might look like this:
| Current Asset | Amount |
|---|---|
| Cash & equivalents | $42,000 |
| Accounts receivable | $8,500 |
| Merchandise inventory | $185,000 |
| Prepaid expenses | $4,200 |
| Total Current Assets | $239,700 |
Source: Balance sheet structure per Retail Dogma, Lumen Learning Retail Management, 2025
Fixed Assets and Long-Term Assets for Retail Stores
Non-current assets — also called fixed or long-term assets — are resources the business holds for more than 12 months. These tend to be smaller in dollar value than inventory for most retailers, but they still matter for your net worth calculation and depreciation tax treatment.
Leasehold Improvements: Money spent physically improving a leased space — custom shelving, flooring, lighting installations, fitting rooms. Capitalized and depreciated over the shorter of the lease term or the asset’s useful life.
Equipment and Fixtures: POS systems, display cases, refrigeration units (food retail), security systems, barcode scanners. Depreciated over their expected useful life, typically three to seven years depending on asset type.
Vehicles: Delivery vans or store vehicles owned by the business.
Intangible Assets: Brand value, customer lists, or proprietary software. Minimal or absent for most small retail stores unless you’ve acquired another business.
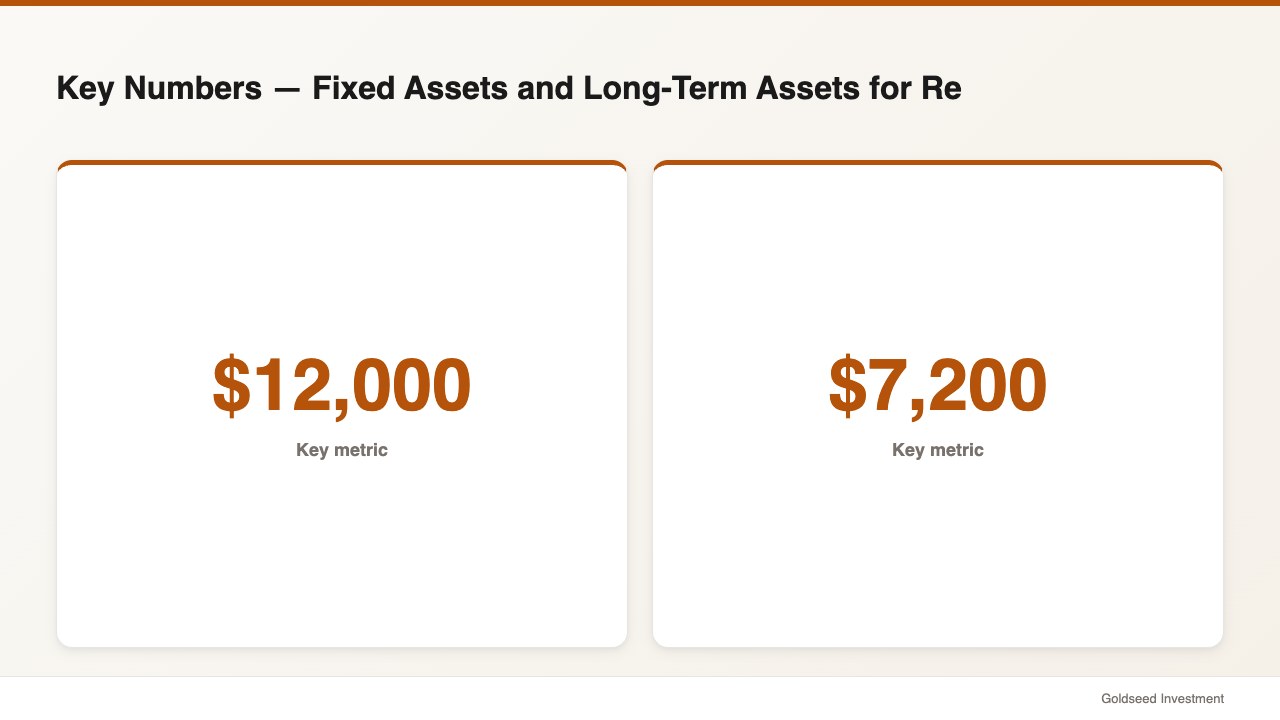
Note on depreciation: your balance sheet shows net book value — original cost minus accumulated depreciation. A POS system purchased for $12,000 two years ago on a five-year straight-line schedule would appear at $7,200. Many owners forget this when trying to estimate total asset value.
Retail Liabilities: What You Owe and When It’s Due
Liabilities are obligations owed to outside parties. Split between current liabilities (due within 12 months) and long-term liabilities (due beyond 12 months), this section often surprises small retail store financial statement first-timers — particularly when operating lease obligations are included.
Current Liabilities for a retail store typically include:
- Accounts Payable: Money owed to product suppliers for inventory already received but not yet paid. Managing supplier payment terms — 30 days, 45 days, 60 days — is a core cash flow management skill in retail. retail store profit margin
- Accrued Wages: Wages earned by employees but not yet paid at the balance sheet date. If you pay bi-weekly and your balance sheet is prepared mid-cycle, there’s likely a meaningful accrued wages figure.
- Sales Tax Payable: Tax collected from customers but not yet remitted to the state.
- Short-term loan portions: Principal payments on any loan due within the next 12 months.
Long-term Liabilities include:
- Business loans: The portion of any outstanding loan balance due beyond 12 months.
- Lease obligations: Under ASC 842 (the U.S. accounting standard updated in 2019 and now fully enforced), operating leases for retail spaces must appear as a liability on the balance sheet. Many small retailers are still not recording this, creating understated liabilities.
- SBA or other term loans: Outstanding balance beyond the 12-month current portion.
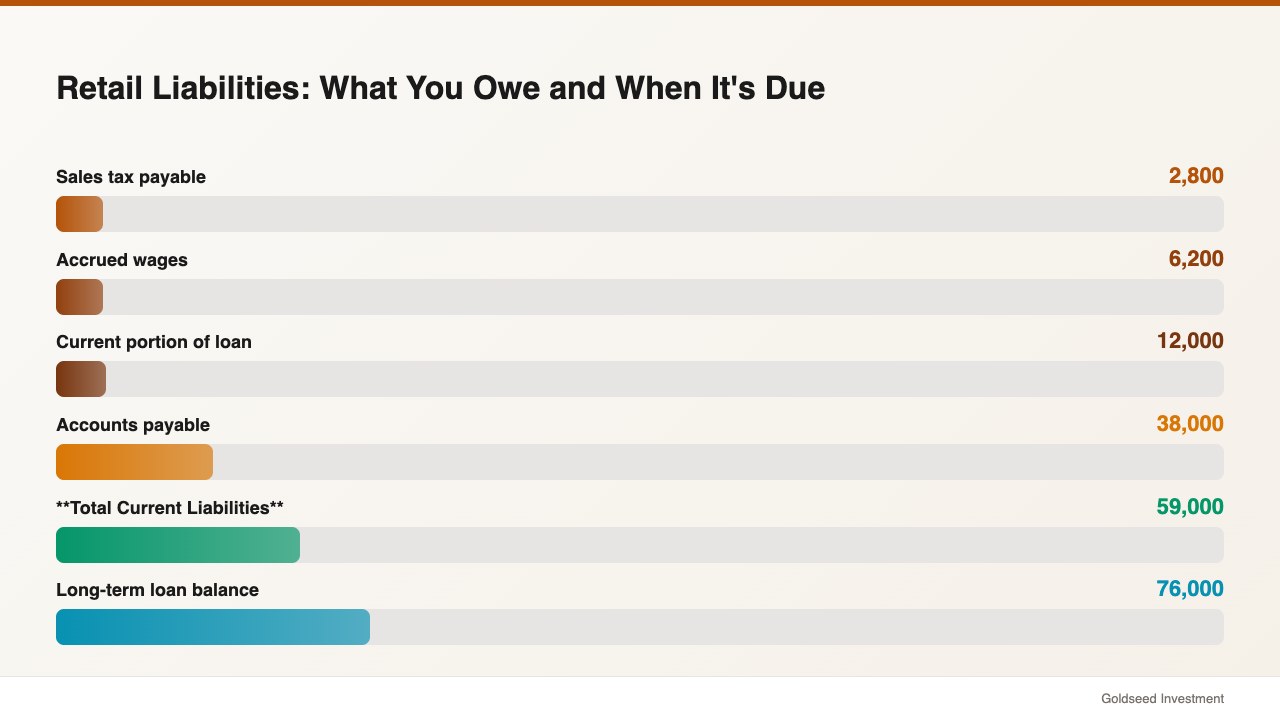
A sample liabilities section for a 3-year-old specialty retailer might look like:
| Liability | Amount |
|---|---|
| Accounts payable | $38,000 |
| Accrued wages | $6,200 |
| Sales tax payable | $2,800 |
| Current portion of loan | $12,000 |
| Total Current Liabilities | $59,000 |
| Long-term loan balance | $76,000 |
| Operating lease obligation | $148,000 |
| Total Long-Term Liabilities | $224,000 |
| Total Liabilities | $283,000 |
Source: Structure per Square Small Business Guide; ASC 842 operating lease requirements, 2025
Owner’s Equity Section Explained
Owner’s equity — also called net worth or shareholders’ equity — is what remains after subtracting total liabilities from total assets. It is the theoretical value of the business to its owner(s).
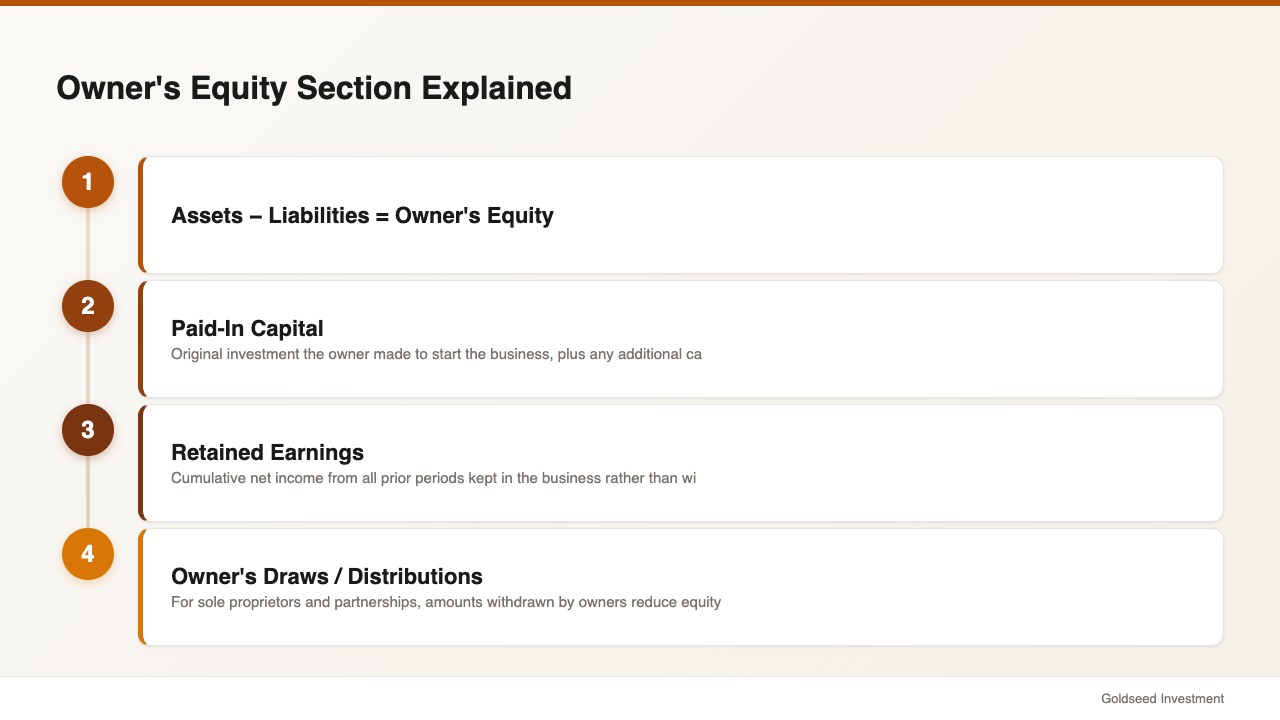
Assets − Liabilities = Owner’s Equity
Understanding how to make a balance sheet for a retail store means understanding the equity section well. It typically contains:
Paid-In Capital: Original investment the owner made to start the business, plus any additional capital contributions since then.
Retained Earnings: Cumulative net income from all prior periods kept in the business rather than withdrawn. This number grows each year the store is profitable, and shrinks when losses occur or when the owner makes draws.
Owner’s Draws / Distributions: For sole proprietors and partnerships, amounts withdrawn by owners reduce equity directly.
Negative owner’s equity — where liabilities exceed assets — signals technical insolvency. This tends to happen when early losses or large debt have not been offset by retained earnings over time. It’s a warning sign that warrants attention, and a reason why retail store assets liabilities equity tracking on a monthly basis is valuable rather than an annual exercise.
Key Balance Sheet Ratios for Retail Stores
Once your balance sheet is prepared, several ratios help interpret what the numbers mean. These retail balance sheet ratios are what banks and investors look at first:
Current Ratio = Current Assets ÷ Current Liabilities
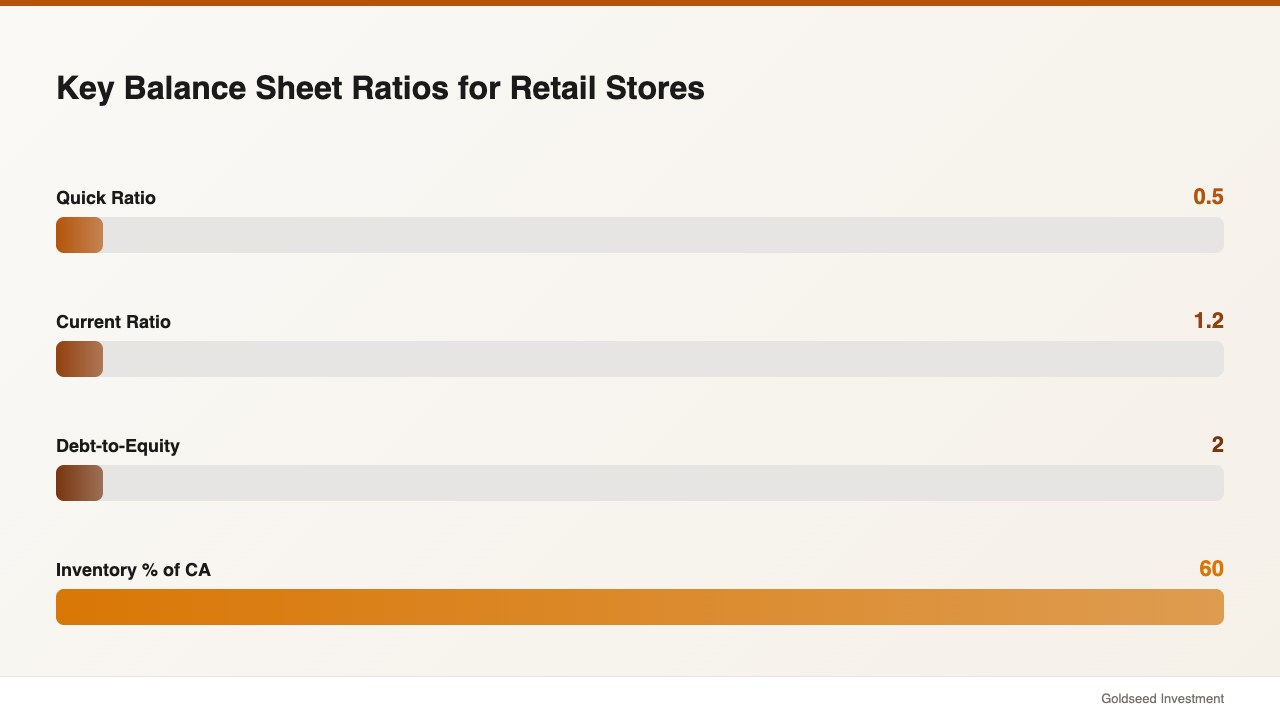
Measures your ability to pay short-term obligations with short-term assets. According to Eqvista’s 2025 industry benchmarks, a healthy retail current ratio sits between 1.2 and 1.5. The retail industry average is approximately 1.186. Below 1.0 means current liabilities exceed current assets — a cash flow risk signal, particularly around supplier payment cycles.
Quick Ratio = (Current Assets − Inventory) ÷ Current Liabilities
More conservative than current ratio because it excludes inventory, which can’t always be liquidated quickly for full value. Above 0.5 is generally acceptable for retail; above 1.0 is strong.
Debt-to-Equity Ratio = Total Liabilities ÷ Owner’s Equity
Shows how leveraged the business is. Higher ratios mean more debt relative to owner stake — acceptable in growing businesses but potentially concerning if cash flow is tight.
Inventory-to-Current Assets Ratio: In retail, inventory often represents 60–80% of total current assets. Significantly higher means the store may be over-invested in slow-moving stock.
| Ratio | Formula | Healthy Range (Retail 2026) |
|---|---|---|
| Current Ratio | Current Assets ÷ Current Liabilities | 1.2 – 1.5 |
| Quick Ratio | (Current Assets − Inventory) ÷ Current Liabilities | 0.5 – 1.0 |
| Debt-to-Equity | Total Liabilities ÷ Owner’s Equity | < 2.0 |
| Inventory % of CA | Inventory ÷ Current Assets | 60 – 80% |
Source: Eqvista Current Ratio by Industry, CFA Journal Retail Benchmarks, 2025
Step-by-Step: How to Build Your Retail Balance Sheet
Building your first retail balance sheet is more manageable than it looks. Here is how to approach it in seven steps:
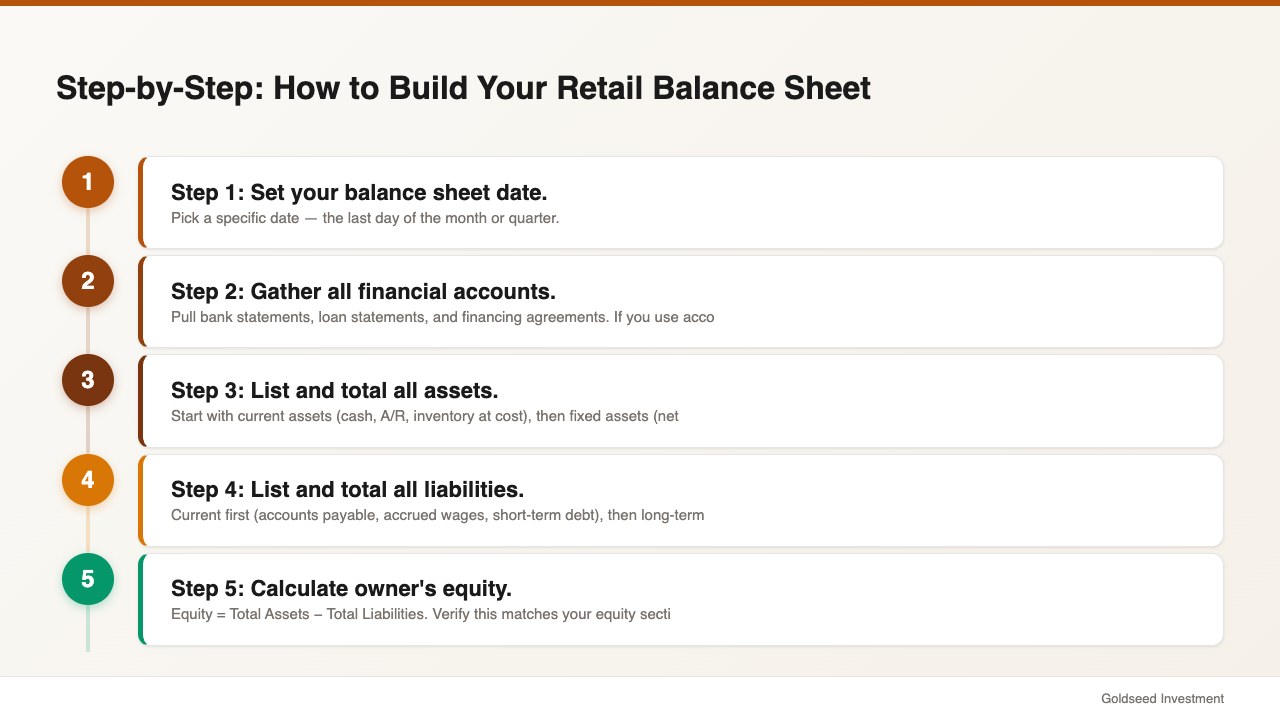
Step 1: Set your balance sheet date. Pick a specific date — the last day of the month or quarter.
Step 2: Gather all financial accounts. Pull bank statements, loan statements, and financing agreements. If you use accounting software (QuickBooks, Xero, Wave), most data is already organized — you’re compiling it into a structured format.
Step 3: List and total all assets. Start with current assets (cash, A/R, inventory at cost), then fixed assets (net of depreciation). Depreciation figures come from your accountant or your software’s depreciation schedule.
Step 4: List and total all liabilities. Current first (accounts payable, accrued wages, short-term debt), then long-term (loan balances, lease obligations).
Step 5: Calculate owner’s equity. Equity = Total Assets − Total Liabilities. Verify this matches your equity section (paid-in capital + retained earnings ± draws).
Step 6: Confirm it balances. Assets must equal Liabilities + Equity. If they don’t, something has been double-counted or omitted. Common culprits: an intercompany transfer, a forgotten loan, or an incorrectly recorded owner’s draw.
Step 7: Review and compare to prior periods. Compare this period’s balance sheet to last quarter and to the same period in 2025 or 2024. Is inventory growing faster than sales? Is accounts payable stretching relative to current assets? Balance sheet trends reveal problems the income statement doesn’t show clearly.
Common Retail Balance Sheet Mistakes to Avoid
Most errors in retail balance sheets fall into predictable patterns. Watch for these:
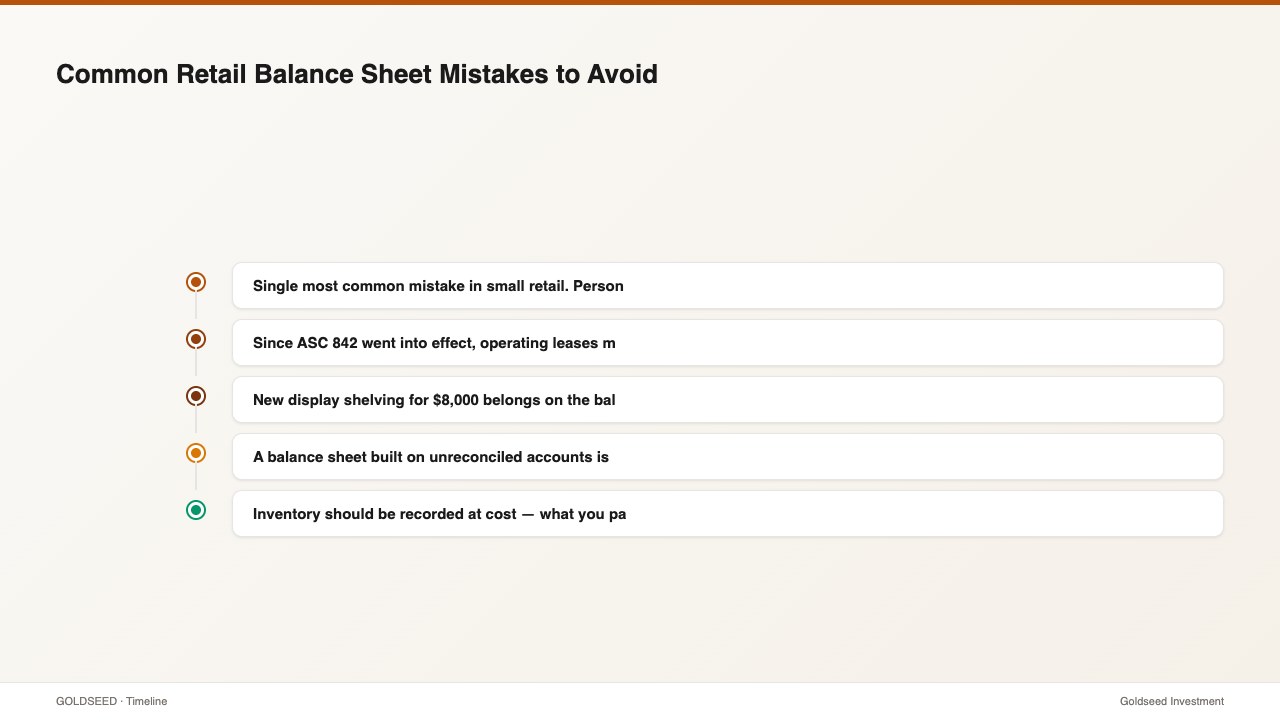
Mixing personal and business accounts: Single most common mistake in small retail. Personal credit card purchases mixed into business accounts create a balance sheet that’s impossible to trust.
Forgetting lease obligations: Since ASC 842 went into effect, operating leases must appear on the balance sheet. Many small retailers are still not recording this, creating understated liabilities.
Mis-categorizing fixed assets as expenses: New display shelving for $8,000 belongs on the balance sheet as a fixed asset — not directly on the income statement. Expensing it directly understates your assets and overstates current-period costs.
Not reconciling accounts monthly: A balance sheet built on unreconciled accounts is unreliable. Pull bank statements and reconcile each account before finalizing.
Using retail value for inventory: Inventory should be recorded at cost — what you paid for it — not at the price you sell it for. Using retail value overstates assets and distorts every ratio you calculate.
Omitting accounts payable from smaller suppliers: It tends to be informal credit — the supplier you pay in 30–45 days without a formal invoice — that gets left off. Make sure every amount you owe is included.
Calculate, review, and compare your balance sheet every month. Stores that catch balance sheet problems early in 2026 tend to have more options for fixing them than those that discover issues only at year-end.
FAQ
Q: What is a good current ratio for a retail store? A: Industry benchmarks suggest a current ratio of 1.2 to 1.5 is healthy for most retail formats. Above 1.5 may indicate excess cash or slow-moving inventory. Below 1.0 signals that current liabilities exceed current assets — which often leads to difficulty paying suppliers on time and can trigger tighter vendor credit terms. The retail industry average in 2025 sits at approximately 1.186, per CFA Journal data.
Q: How often should I prepare my balance sheet? A: Monthly is best practice for any retail store with meaningful inventory, active supplier credit, or outstanding business loans. Quarterly at minimum. Annual-only balance sheets make it difficult to catch cash flow problems before they become critical. Many retailers notice inventory buildup or accounts payable creep only when they review the balance sheet monthly and see the trend developing.
Q: What is the difference between a balance sheet and an income statement? A: An income statement shows revenue, expenses, and net income over a period of time. A balance sheet shows what the business owns and owes at a specific point in time. You need both: the income statement tells you if you made money; the balance sheet tells you if the business is financially healthy. Both should be reviewed together on a monthly basis. retail store profit margin
Q: Does my retail store need a balance sheet if it’s profitable? A: Yes. Profitability and financial health are related but not identical. A retail store can be profitable on its income statement while carrying dangerous debt levels or being technically insolvent if liabilities exceed assets. Many retail businesses that failed in recent years were profitable in their final operating year — but their balance sheets showed warning signs that were never addressed. Treat the balance sheet as your store’s financial X-ray.
Sources: Square — Balance Sheet for Small Business; Lumen Learning — Introduction to Balance Sheets, Retail Management; Eqvista — Current Ratio by Industry, 2025; CFA Journal — Average Current Ratio for Retail Industry; Retail Dogma — Retailer Balance Sheet Explained