Convenience store owners who use daily sales report software like Storebase see each store’s revenue, margin, and cash by morning instead of month-end — and cut the time spent chasing numbers from hours a week to near zero.
Today, Sam Okafor opens a single screen each morning and sees exactly how both of his Phoenix convenience stores did yesterday — total sales, gross margin, cash over or short, and which categories moved. He knows it before he finishes his coffee, and before either manager texts him. A year ago he was flying blind until the books closed at month-end, piecing together register tapes and manager messages to guess at a number that was already three weeks stale. The change came from daily sales report software — in his case, Storebase — that sits on top of the POS he already runs. This guide covers why owners go so long without seeing their numbers, what a real daily sales report should show, and how the pieces fit for a small chain.
Why Can’t Most Convenience Store Owners See Yesterday’s Numbers?
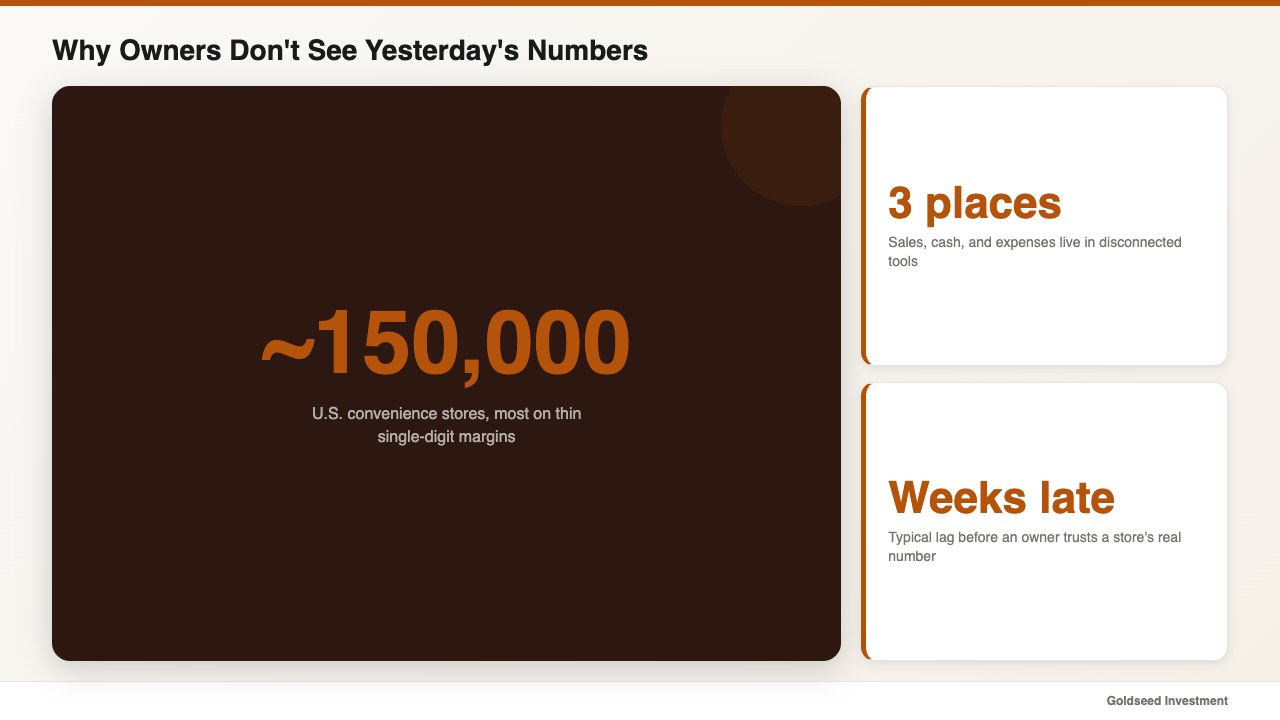
Most owners cannot see yesterday’s numbers because the data sits in three disconnected places. The POS holds sales, a notebook or app holds cash, and expenses live in a spreadsheet — and nothing pulls them into one daily figure. So the owner waits, asks a manager, or reconstructs it weeks later.
The convenience channel makes the lag costly. The National Association of Convenience Stores counts roughly 150,000 c-stores in the United States, most running on thin single-digit margins where a bad week needs a fast response, not a month-end autopsy. When a slow category or a cash shortage hides until the books close, the chance to fix it has already passed. Daily sales tracking exists to close that gap.
This is not a discipline problem; it is a plumbing problem. No single tool was built to merge sales, cash, and cost into a morning report, so owners improvise — and the improvised version tends to arrive too late to matter. For the financial side of reading those numbers, our walkthrough on how to analyze retail store profitability shows what to look at once the report lands.
The Hidden Cost of Finding Out Your Sales a Month Late
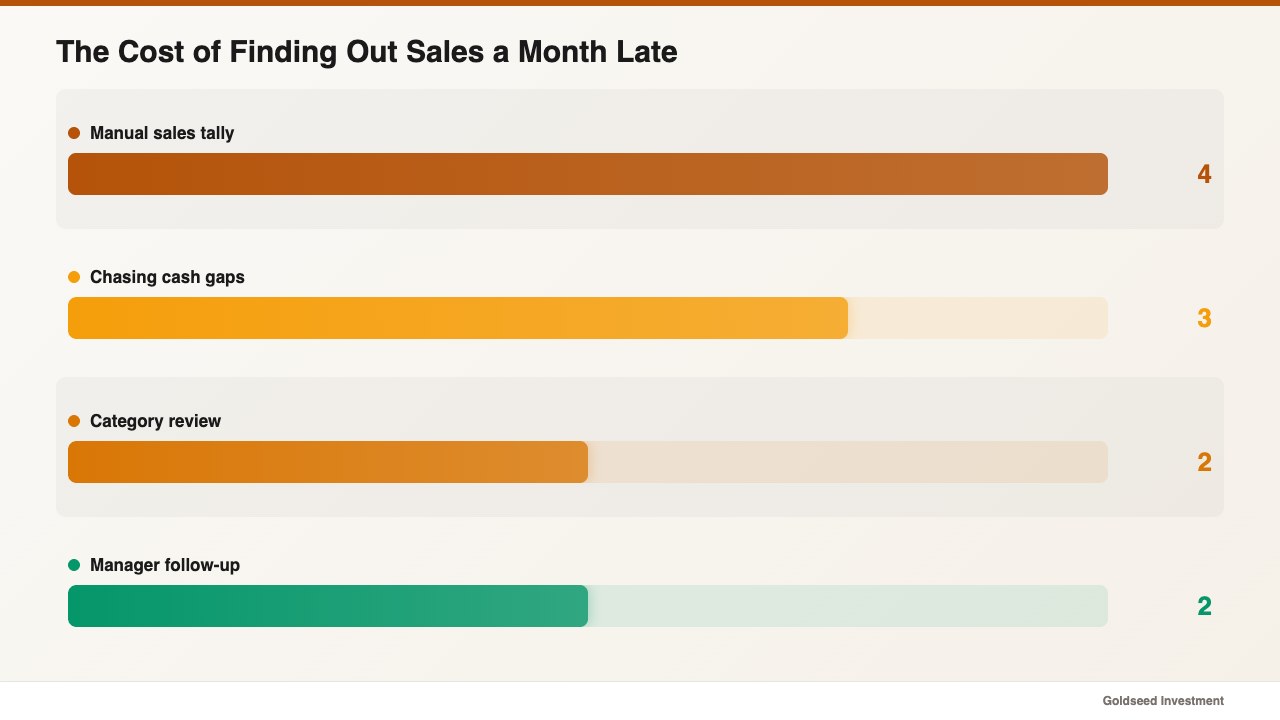
The hidden cost of late numbers is the decisions you cannot make in time. Sam was spending close to four hours a week stitching register exports together with manager texts, and still could not trust the total. Worse, a drawer that ran short on a Tuesday would not surface until the month-end reconciliation, by which point the trail had gone cold.
One operator who ran several locations described the trap this way:
> “Every time a manager called, I’d pull the data into a spreadsheet and work it by hand. By the time I understood what happened, the week was already gone.”
The math is unforgiving. Four hours a week of manual tallying is roughly 200 hours a year, and a back office that catches a cash or margin problem weeks late tends to absorb the loss rather than stop it. Industry data underlines the risk: the National Retail Federation puts annual retail shrink at $112.1 billion, about 1.6% of sales, and the U.S. Census Bureau shows how thin the margin for error already is. Pull your own routine for “how did we do yesterday” and time it honestly; in many cases the answer is “I don’t really know until later.”
What Should a Daily Sales Report Actually Show You?
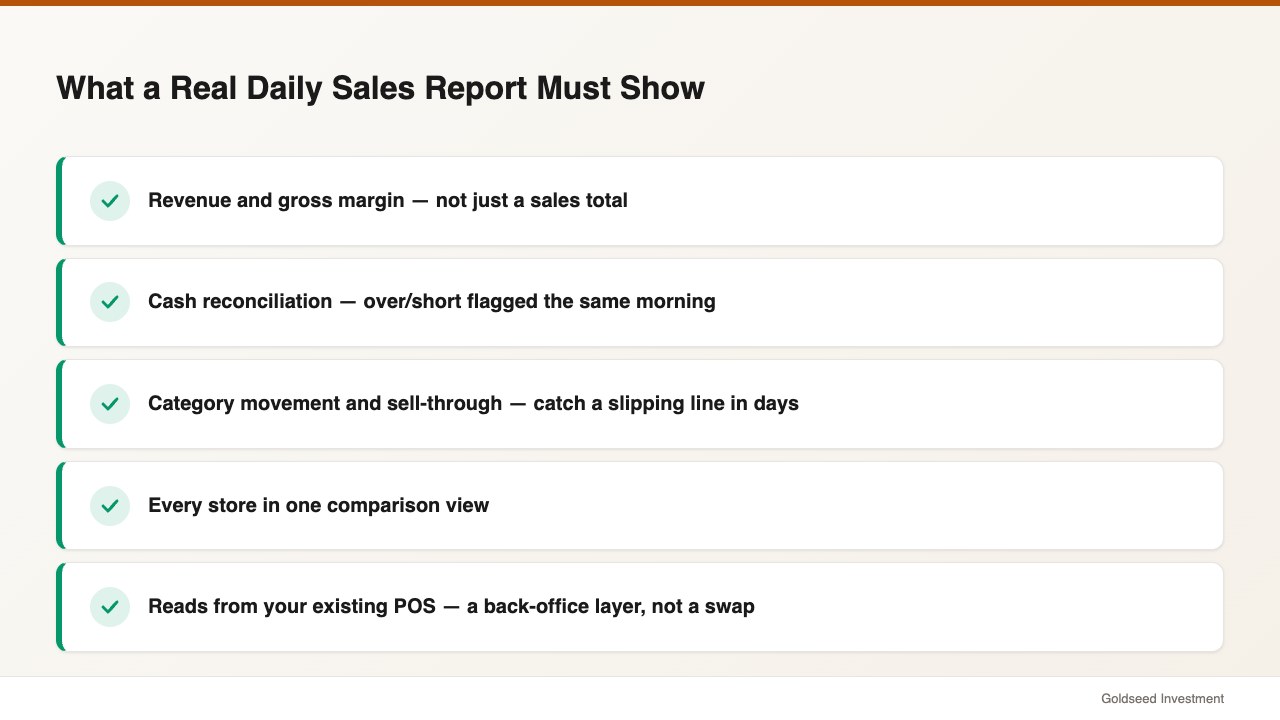
A daily sales report should answer four questions before you reach the store, not just print a sales total. Anything less leaves you guessing.
- Revenue and margin, not just sales. Show net sales alongside gross margin, so a high-sales day with thin margin does not fool you.
- Cash reconciliation. Tie the day’s sales to the drawer count and flag any over or short the same morning, with a per-entry log.
- Category movement. Highlight which categories rose or fell and their sell-through, so a slipping line or a COGS creep shows up in days, not at quarter-end.
- Every store in one view. Compare locations side by side instead of opening a separate report per store.
A point that matters for c-store owners: good reporting software is a back-office layer, not a POS replacement. It should read from Square, Clover, Toast, or Lightspeed rather than forcing a counter swap. Ask any vendor whether their report works on top of your existing POS before you commit.
How Does Daily Sales Report Software Compare for a C-Store?
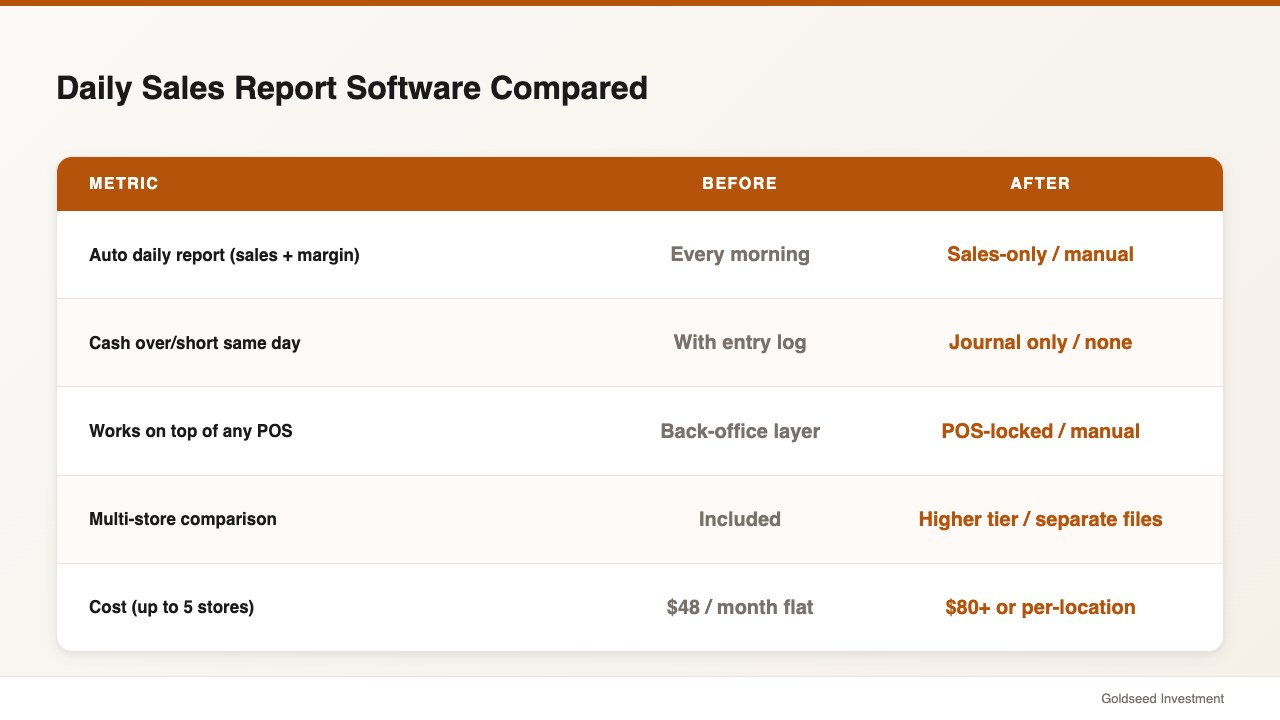
Owners usually weigh dedicated reporting software against the POS dashboard they already have or a spreadsheet they maintain by hand. The honest question is whether the report merges sales, cash, and margin — and whether it covers every store without extra cost.
| Feature | Storebase | Square | QuickBooks | Spreadsheet |
|---|---|---|---|---|
| Auto daily report (sales + margin) | ✅ Every morning | ⚠️ Sales only | ⚠️ Manual run | ❌ Manual |
| Cash over/short same day | ✅ With entry log | ❌ No | ⚠️ Journal only | ❌ Manual |
| Works on top of any POS | ✅ Back-office layer | ⚠️ Square only | ⚠️ Limited sync | ❌ Manual export |
| Multi-store comparison | ✅ Included | ⚠️ Higher tier | ⚠️ Per-entity | ❌ Separate files |
| Monthly cost | $18 (Starter, 1 store) / $48 (Growth, up to 5 stores) | $0 + add-ons | $80+/mo | Free (hours/wk labor) |
Source: vendor pricing pages, 2025–2026.
The pattern is consistent: a POS reports its own sales well, and accounting tools handle the books, but neither delivers a same-morning report that blends sales, cash, and margin across locations. That gap is the reason dedicated daily sales report software exists.
How Sam Uses Storebase to Get a Daily Sales Report Every Morning
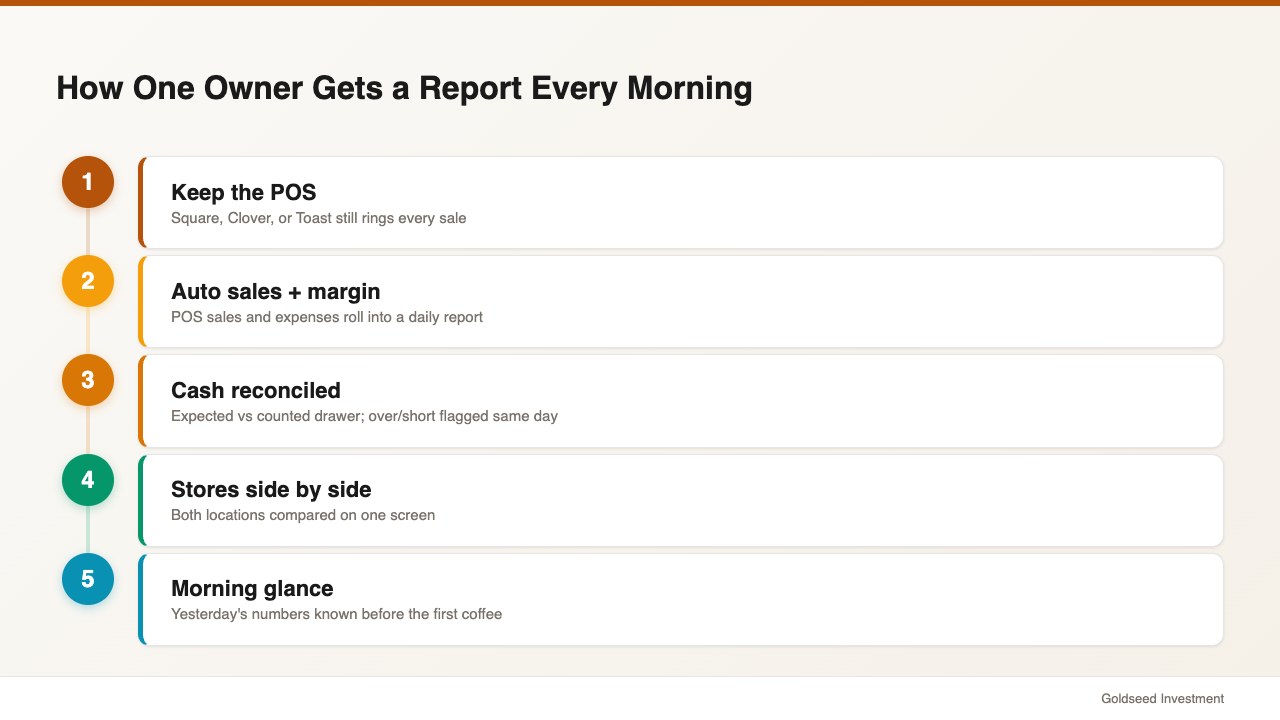
Sam built his morning report on three connected parts, and it paid off in the first week.
First, an automatic sales-and-margin report. Through the Sales & Finance module, POS sales and logged expenses roll into a daily report showing revenue, gross margin, and net for each store. The four-hour weekly tally went from a manual chore to a glance — his reporting time dropped from 4 hours a week to near zero.
Second, cash tied to the day’s sales. With the Cash Management module, the morning report reconciles expected cash against the counted drawer and flags any over or short, with a per-entry log showing who entered what and when. The week-late mystery shortfalls reduced from a monthly surprise to a same-day flag.
Third, every store side by side. A multi-store dashboard puts both locations on one screen, so Sam can compare yesterday’s performance and spot a slipping category in days. Across his two stores, the time from “close” to “I know the number” went from three weeks to the next morning.
Because the report reads from his existing POS rather than replacing it, nothing changed at the counter. The register keeps ringing sales; the back office turns them into a report he can act on the same morning instead of weeks later.
What Should You Check Before Choosing Reporting Software?
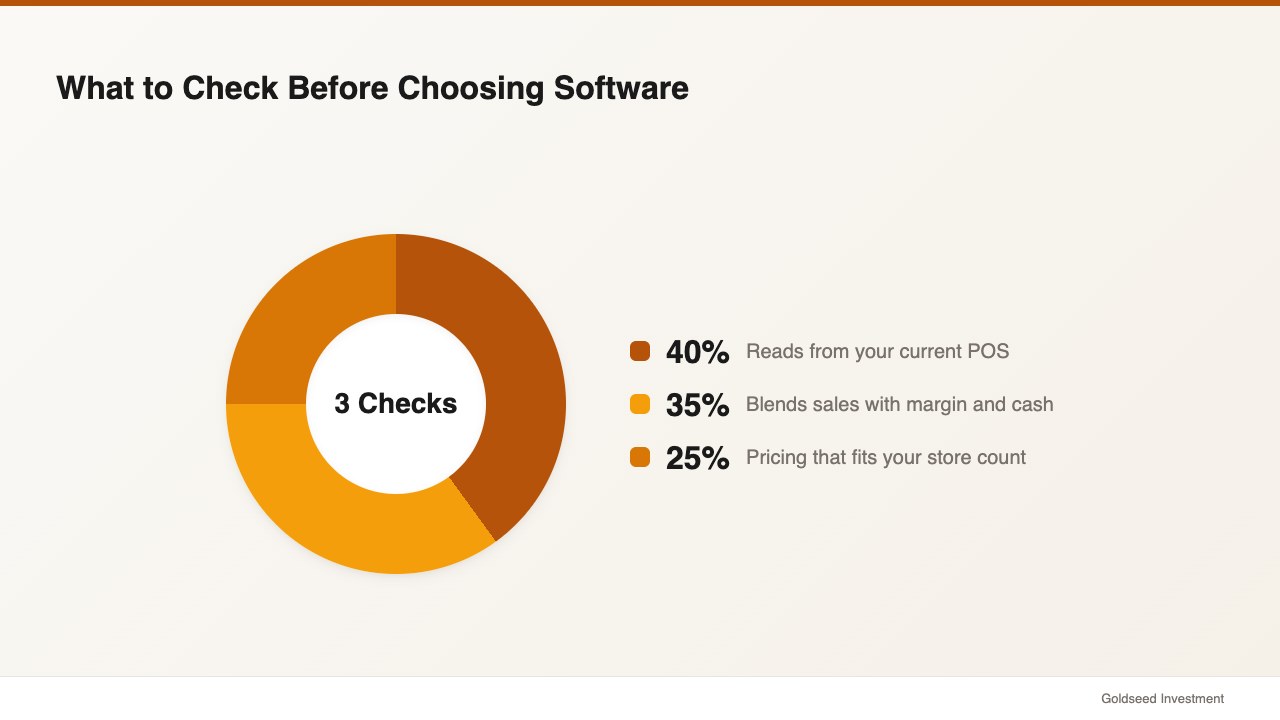
Check three things before you commit to any reporting tool. First, confirm it reads from your current POS so you avoid a costly counter migration. Second, make sure the report blends sales with margin and cash — a sales-only number tends to flatter a thin-margin day. Third, price it at the store count you actually run, since per-location pricing can make a two- or three-store chain far more expensive than a flat plan covering up to five stores for $48 a month.
Start by writing down the exact question you want answered each morning, then test whether the report answers it without manual work. For the reporting and statements layer, see our guide to retail financial management software, and for category-level margin context, our breakdown of retail store profit margin benchmarks.
FAQ
Q: What is the best daily sales report software for a convenience store? A: The best fit depends on whether you want to keep your POS and how many stores you run. A back-office app that layers on any POS and merges sales, margin, and cash into one morning report tends to suit small c-store chains better than a POS dashboard alone, because it answers more than “what did we ring up.”
Q: How much does convenience store sales reporting software cost? A: Pricing varies. POS add-ons and accounting tools often start near $80 a month, and per-location reporting can climb fast. An all-in-one back-office option starts around $18 a month for one store and $48 a month for up to five stores, which usually undercuts stacking separate tools.
Q: Can I get a daily sales report without changing my POS? A: Yes. A back-office reporting layer reads from your POS — Square, Clover, Toast, or Lightspeed — and adds the daily report, cash reconciliation, and multi-store view on top. Your POS still handles every sale at the counter.
Q: How often should a convenience store review its sales numbers? A: Daily is the practical target. Reviewing yesterday’s sales, margin, and cash each morning lets you catch a slow category or a cash issue in days instead of at month-end, when the chance to respond has usually passed.
The Bottom Line
Daily sales report software earns its place by turning yesterday into a number you can act on this morning, blending sales, margin, and cash across every store. Decide the question you need answered each day, insist the report reads from your existing POS, and price it for your store count. If you still find out how you did weeks after the fact, Storebase delivers the report by morning — most owners are live in under 10 minutes, no credit card required. Start free with Sales & Finance → or Download on the App Store →