Retail stores that run a structured shrinkage audit every quarter tend to cut unexplained inventory loss by 30% to 45% within a year — because they stop guessing at the cause and start measuring it.
Devon Marsh runs three convenience stores outside Columbus. For two years his system showed 50 units of a fast-moving SKU on the shelf when the real count was closer to 42. He had no way to know whether the gap came from theft, a receiving error, or a cashier mistake. That blind spot is exactly what a retail shrinkage audit process guide is built to close. This guide walks through how to measure shrink, run the audit itself, trace each discrepancy to its root cause, and decide how often to repeat the work. The goal is a process you can hand to a manager and trust without standing in the store yourself.
What Is a Retail Shrinkage Audit — and Why Does It Matter?
A retail shrinkage audit is a structured comparison between what your records say you should have and what you physically count, followed by an investigation into every gap. Shrinkage itself is the difference between book inventory and actual inventory, expressed as a percentage of sales.
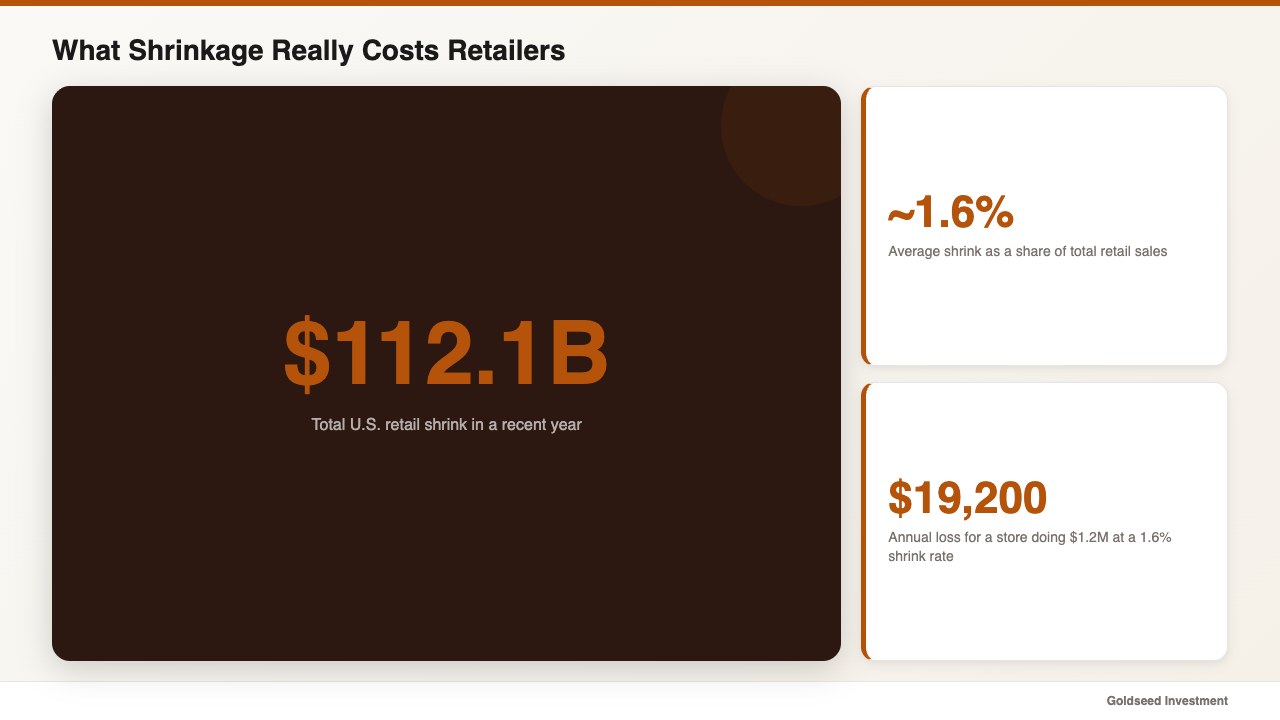
The numbers are not small. According to the National Retail Federation’s National Retail Security Survey, retail shrink reached $112.1 billion in a recent year, or roughly 1.6% of total retail sales — a figure worth sizing against the U.S. Census Bureau’s monthly retail sales data. For a store doing $1.2 million a year, a 1.6% shrink rate quietly removes about $19,200 from the bottom line — often more than a full month of profit. Through 2025 and into 2026, that pressure has only grown as thinner gross margins leave less room to absorb loss.
Most owners treat that loss as a cost of doing business. It rarely is. In many cases the gap is traceable, and a disciplined inventory shrinkage review tends to recover a meaningful share of it. The audit matters because it converts a vague worry into a specific, fixable number. If you want to understand where your store sits against typical benchmarks, start with what counts as a normal retail shrinkage rate before you judge your own figures.
How Do You Calculate Your Shrinkage Rate Before the Audit?
Calculate your shrinkage rate first, because the audit needs a baseline to chase. The formula is direct:
Shrinkage Rate = (Book Inventory Value − Physical Inventory Value) ÷ Net Sales × 100
Suppose your records show $210,000 in inventory at cost, your physical count lands at $204,000, and net sales for the period were $400,000. The shrink is $6,000, and the rate is 1.5%. That single percentage tells you whether you have a containable problem or a structural one.
| Store Type | Typical Shrinkage Rate | Annual Shrink on $1M Sales |
|---|---|---|
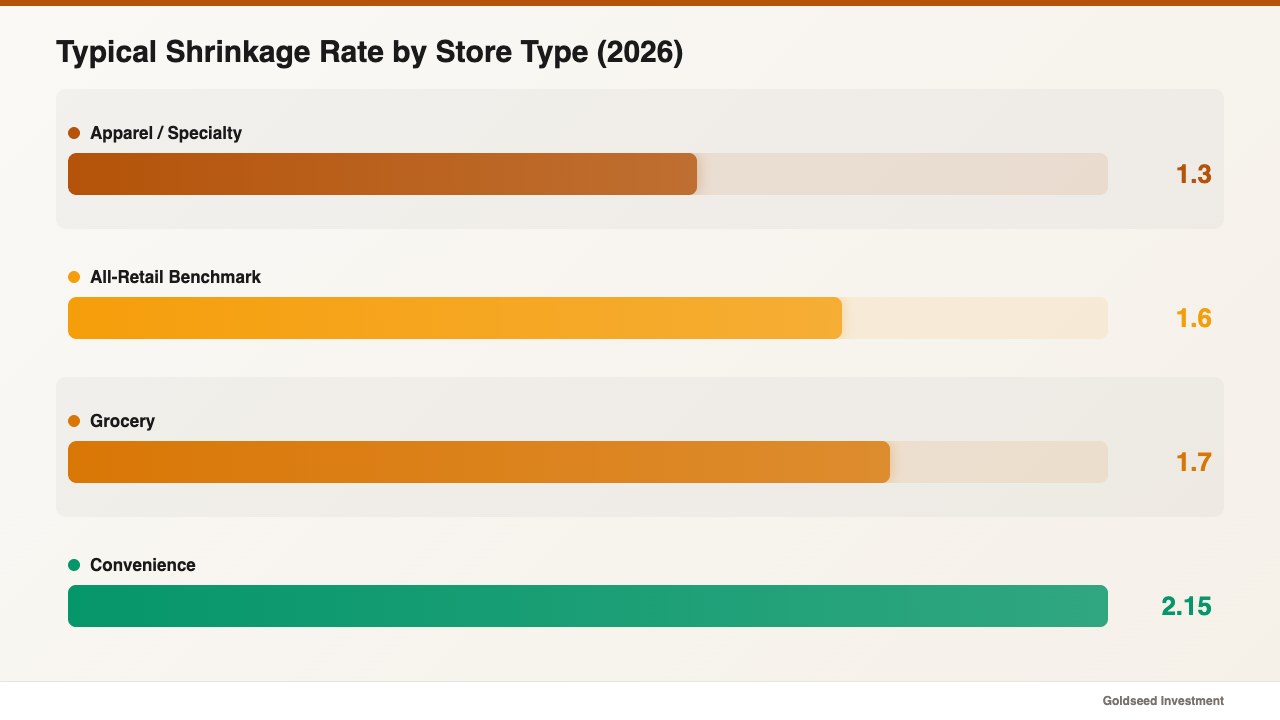
| Convenience store | 1.8% – 2.5% | $18,000 – $25,000 |
| Grocery / supermarket | 1.4% – 2.0% | $14,000 – $20,000 |
| Apparel / specialty | 1.0% – 1.6% | $10,000 – $16,000 |
| General benchmark (all retail) | ~1.6% | ~$16,000 |
Source: National Retail Federation, 2024.
Pull your cost-of-goods-sold figures and your last physical count before you do anything else. If you have never reconciled book value against a real count, your reported rate may be fiction — and the audit will be the first time you see a true number. For the financial side of this work, our walkthrough on how to analyze retail store profitability shows where shrink fits into your margin picture.
What Are the Steps in a Retail Shrinkage Audit Process?
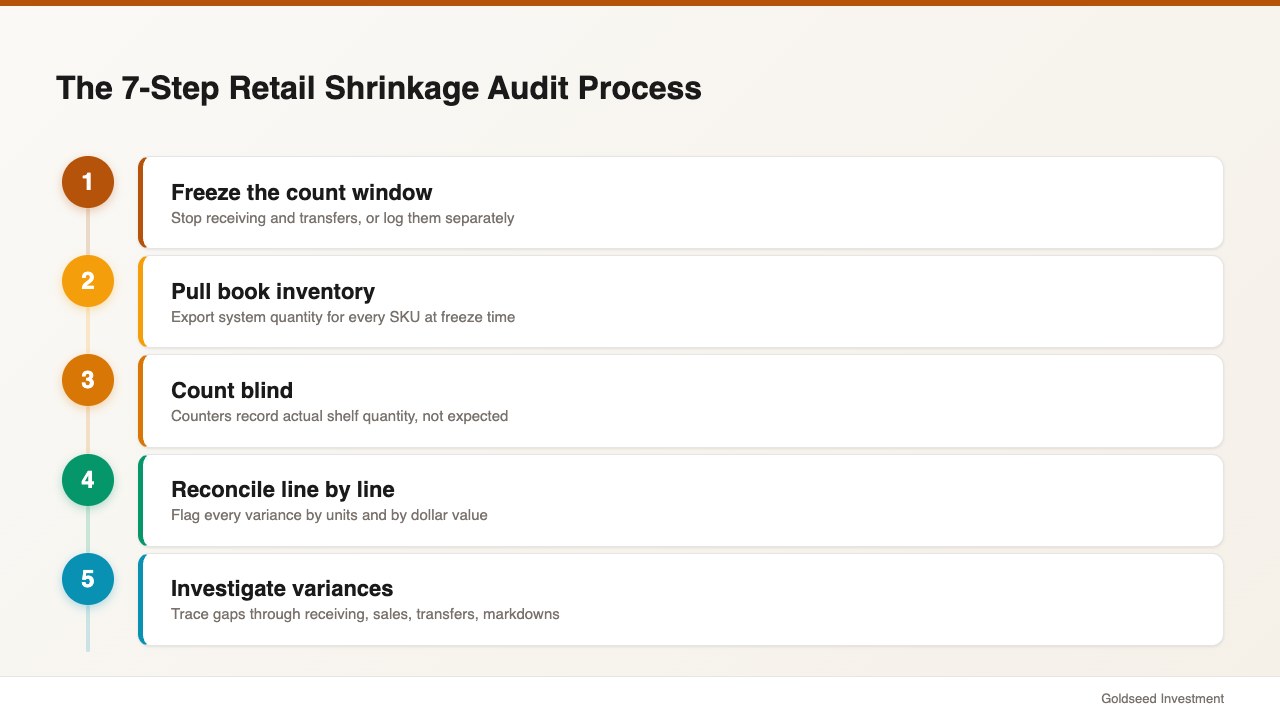
A retail shrinkage audit process follows seven repeatable steps. Treat them as a checklist a manager can run without improvising.
- Freeze the count window. Pick a date and stop inbound receiving and transfers during the count, or record them separately. Movement during a count is the single most common source of false discrepancies.
- Pull book inventory. Export the system-of-record quantity for every SKU as of the freeze time.
- Run a physical inventory count. Count blind — counters should not see the expected number, so they record what is actually on the shelf rather than what the system predicts.
- Reconcile line by line. Match physical to book for each SKU and flag every variance above a set threshold, by units and by dollar value.
- Investigate the flagged variances. This is where the audit earns its keep. Trace each gap back through receiving, sales, transfers, and markdowns.
- Classify each loss. Assign every confirmed gap a cause: administrative error, vendor shortage, internal theft, or external theft.
- Document and act. Record findings, adjust book inventory, and assign a specific corrective action with an owner and a deadline.
Run step three at least twice on high-value categories. A second count tends to catch counting mistakes that would otherwise be logged as loss. The discipline of a clean physical inventory count is what separates an audit that finds answers from one that just produces a new number to worry about.
What’s Really Behind Your Shrink — and How Can You Catch It Early?
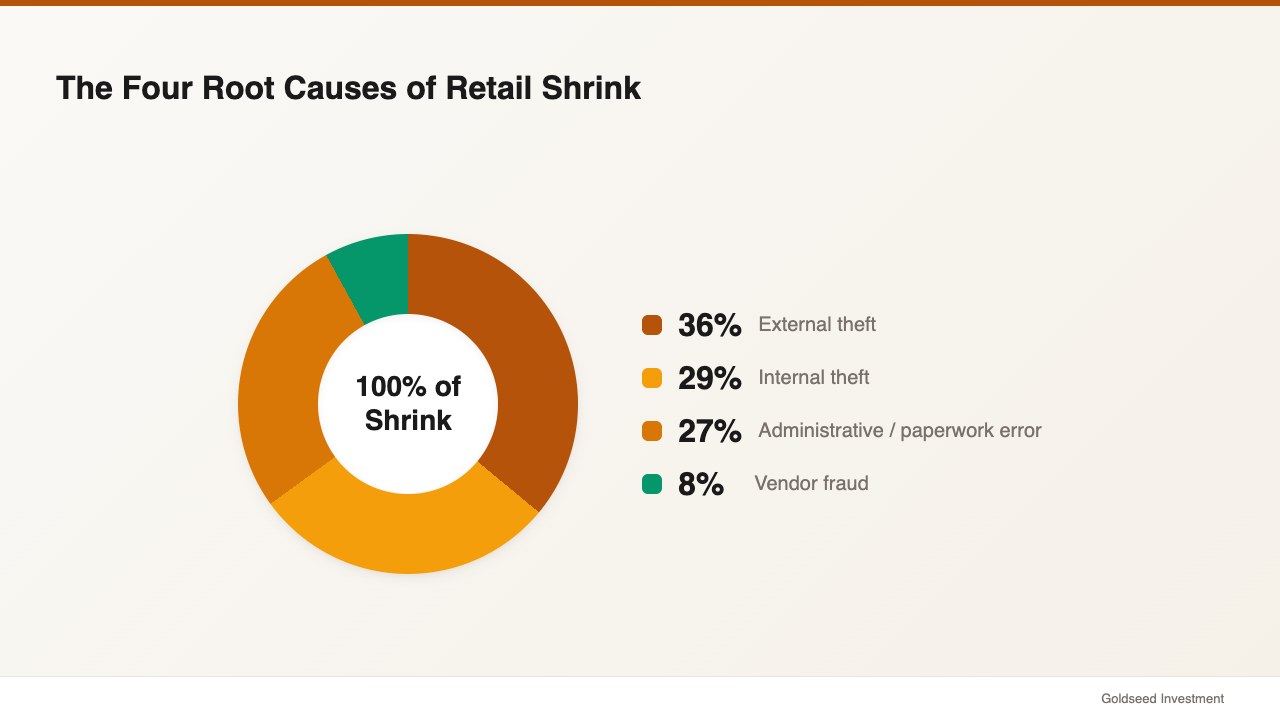
Shrink has four root causes, and the audit exists to tell them apart. Industry data suggests external theft and internal theft together account for the majority of shrink, with administrative and paperwork errors close behind, and vendor fraud trailing.
The hard part is attribution. A 7-unit shortfall could be a thief, a miscount, or a delivery that arrived short. Owners often assume the worst and suspect staff, which damages trust without fixing anything. One retail operator described the problem plainly:
> “Before, when numbers didn’t match, I had no way to know if it was theft, a counting error, or a receiving mistake. Now the system tells me statistically whether the discrepancy is random or deliberate.”
That distinction is measurable. If every SKU in a category is short by one unit, random error is statistically unlikely — the pattern points to a process or a person. If shortfalls are scattered and small, a counting or receiving error is the more probable explanation. This is not a knowledge problem; it is a tools problem, and most owners face it because the data trail was never designed to make the call easy.
Catch it early by shortening the gap between counts. The longer the window, the more causes pile on top of each other and the harder attribution becomes. A high staff turnover rate compounds this, because each new hire is a fresh variable in your audit trail; U.S. Bureau of Labor Statistics data shows retail turnover tends to run well above the private-sector average, which is one reason internal-error attribution stays difficult in many stores.
Which Records Should Every Audit Cross-Check?
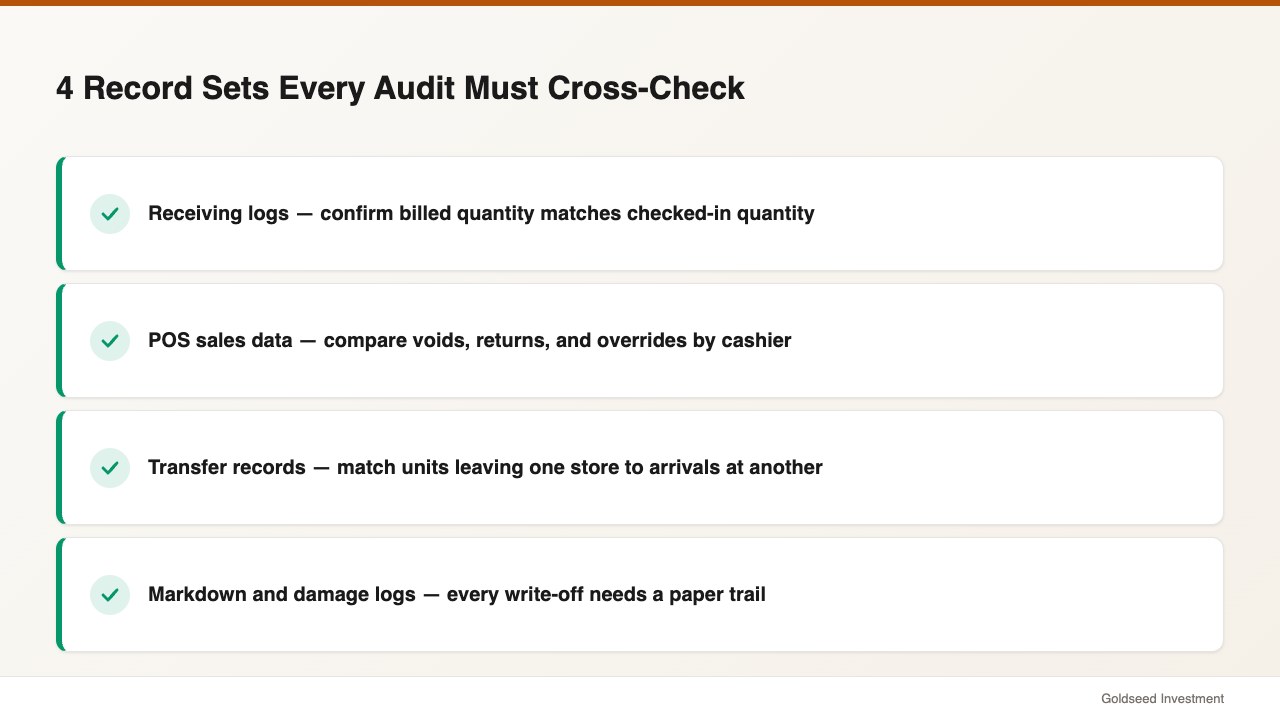
Cross-check four record sets against your physical count, because a discrepancy almost always lives in the seam between two systems.
- Receiving logs. Confirm that what the vendor billed matches what was actually checked in. Short shipments logged as full deliveries create phantom inventory.
- POS sales data. Voids, returns, and manual price overrides are common cover for loss. Compare void rates by cashier and by shift.
- Transfer records. For multi-store operators, units that leave one location but never post at the destination read as shrink at both ends.
- Markdown and damage logs. Product written off as damaged or expired should have a paper trail. Unlogged write-offs inflate apparent theft.
Ask your vendors for delivery confirmations and reconcile them against receiving for at least one full month. An audit trail across these four sources turns a single confusing number into a story you can follow. Multi-location owners in particular tend to find that transfer gaps explain shrink they had blamed on the sales floor.
How Often Should a Retail Store Run a Shrinkage Audit?
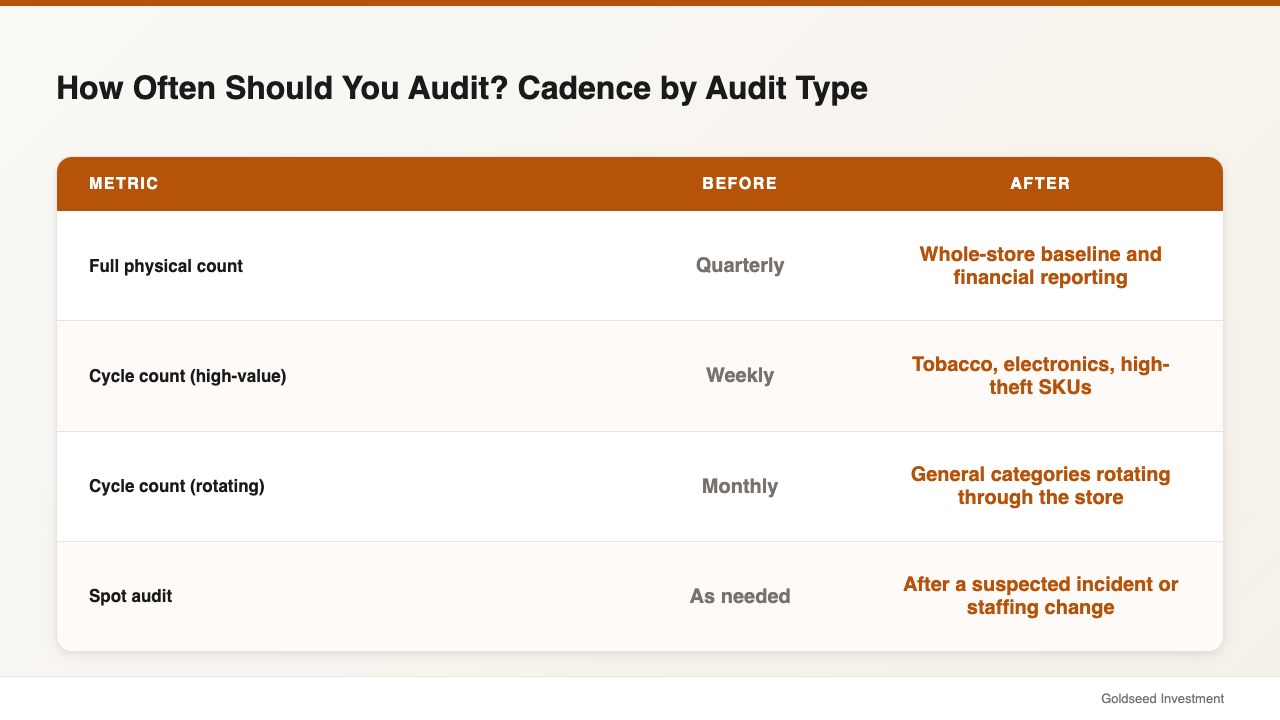
Run a full physical audit at least quarterly, and layer cycle counts on your highest-risk categories weekly or monthly. Annual counts alone tend to be too coarse — by the time you find a problem, it has run for eleven months.
| Audit Type | Cadence | Best For |
|---|---|---|
| Full physical count | Quarterly | Whole-store baseline and financial reporting |
| Cycle count (high-value) | Weekly | Tobacco, electronics, high-theft SKUs |
| Cycle count (rotating) | Monthly | General categories, rotating through the store |
| Spot audit | As needed | After a suspected incident or staffing change |
Source: National Retail Federation, 2024.
The right cadence often depends on your shrink rate and category mix. A store running 2.5% shrink should count high-risk items weekly; a store at 1.0% can lean on monthly cycles. Schedule the counts in advance and rotate categories so no single section goes more than a month without eyes on it. Detailed methods for the count itself are covered in how to run a stock count in a retail store.
What’s the Real ROI of a Disciplined Shrinkage Audit?
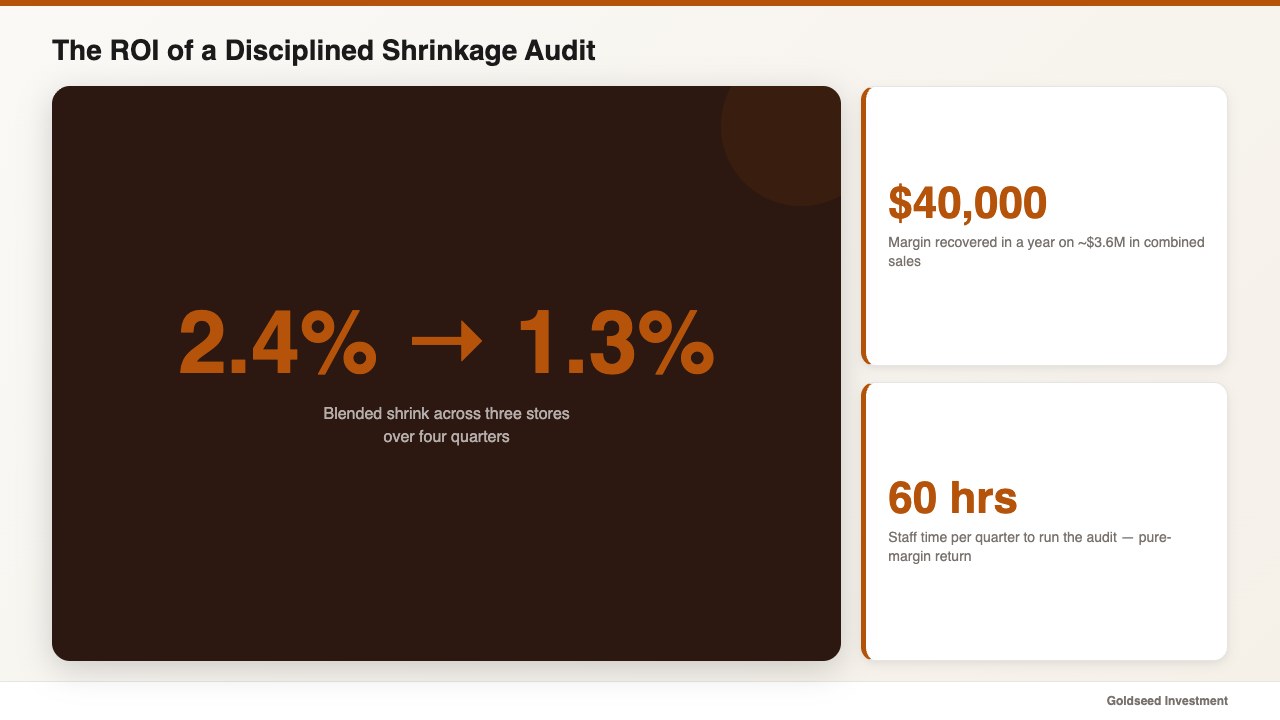
The return on a disciplined audit tends to be large relative to its cost, because the loss it recovers is pure margin. Recovered shrink does not carry the cost of goods, marketing, or labor that ordinary sales do — every dollar saved drops to the bottom line.
Consider Devon’s three stores again. After moving from a single annual count to quarterly audits with weekly cycle counts on tobacco and energy drinks, his blended shrink rate fell from 2.4% to 1.3% over four quarters. On combined sales near $3.6 million, that swing recovered roughly $40,000 in a year. The audit work cost him about 60 staff-hours per quarter — a return that few other store projects can match.
The pattern repeats across operators who commit to the process:
- Blended shrink dropped from 2.4% to 1.3% within twelve months.
- Investigation time per discrepancy fell from 2 days a month to near zero once records were cross-checked at the source.
- Tobacco category shrink fell from 4.1% to 1.9% after weekly cycle counts replaced the annual count.
- Gross margin recovered from 31% to roughly 33% as recovered shrink dropped straight to profit, with no added cost of goods sold (COGS).
- Manager review shifted from daily firefighting to a monthly sign-off, because the audit made accountability visible.
Those gains also tend to show up in sell-through: when dead and miscounted stock stops masking true on-hand levels, reorder accuracy improves and slow movers surface faster.
Revenue is what you sell; margin is what you keep. A shrinkage audit protects the second number, which is the one that decides whether a store survives a slow season. For owners weighing where audits sit against their full financial picture, the income-statement view of store performance ties shrink directly to reported profit.
FAQ
Q: What is a good retail shrinkage rate to aim for? A: Aim for under 1.5%. The general retail benchmark sits near 1.6% of sales, per the National Retail Federation. Convenience and high-theft formats often run higher at 1.8% to 2.5%, while apparel tends to land closer to 1.0% to 1.6%. Anything above 2.5% signals a process problem worth a full audit.
Q: How long does a retail shrinkage audit take? A: A full physical count for a single small store usually takes one overnight session of 6 to 10 staff-hours, plus a half-day for reconciliation and investigation. Cycle counts on a focused category take 30 to 60 minutes. The investigation step varies with how clean your receiving and POS records are.
Q: Can a small store run a shrinkage audit without expensive software? A: Yes. A blind physical count, an exported book-inventory list, and a spreadsheet that flags variances by SKU are enough to start. The limit of manual methods tends to show up in the investigation step, where tracing a discrepancy across receiving, sales, and transfers by hand is slow. Many owners start manual and add tools once they know which gaps recur.
Q: What is the difference between a shrinkage audit and a regular stock count? A: A stock count measures what is on the shelf. A shrinkage audit adds the reconciliation and investigation layers — it compares the count to your records, classifies every gap by cause, and assigns corrective action. The count is one step inside the larger audit process.
Final Word
A retail shrinkage audit process turns an annual headache into a controlled, repeatable habit. Calculate your rate, freeze and count blind, reconcile line by line, and investigate every gap against receiving, POS, transfers, and markdowns. Run the full count quarterly and cycle-count your risky categories far more often. The stores that treat shrink as measurable rather than inevitable are the ones that keep the margin everyone else writes off.